Revista Fuentes: El Reventón Energético

Vol. 15 Nº 2 de 2017 - Jul/Dic - pp 31/47

EVIDENCES OF CDG FORMATION

AND POSSIBLE INTERPRETATIONS

OF CORE FLOOD STUDIES

Daniela Alzate López1*; Juan Manuel León2; Fernando Cabrera3; Eduardo Manrique4 1 Universidad Nacional de Colombia. Facultad de Minas. Calle 80 Carrera 65, Medellín, Colombia.

2 Ecopetrol S.A. Carrera 7 Calle 32. Bogotá D.C, Colombia.

3 Nalco Champion. Calle 100 Calle 19. Bogotá D.C, Colombia.

4 MI3 Petroleum Engineering. 708 13th St., Golden, CO 80401, USA.

*E-mail:dalzatel@unal.edu.co

ABSTRACT

Colloidal Dispersion Gels (CDG’s) have been successfully tested in several countries including Colombia. However, despite numerous successful field results reported in the literature, laboratory-scale experiments have generated controversy regarding the ability to inject CDG’s in large volumes without reducing injectivity while also improving sweep efficiency.

This paper summarizes the updates in microgel technologies, especially the Linked-Polymer Solutions (LPS) that have been also referred as CDG’s leading to misinterpretation of both systems. This brief review will also present the main mechanisms proposed for the formation of LPS in fluid:fluid studies and during its flow in porous media. This study also presents for the first time evidences of the possible mechanisms for the formation of CDG’s using a high molecular weight (MW) partially hydrolyzed polyacrylamide (HPAM) and Aluminum Citrate (Al(Cit)3) as a crosslinker using Dina Cretáceos Field, Colombia, synthetic brine at room temperature (25°C). The results generated during this study were used to re-interpret corefloods injecting CDG in Berea and Tello Field, Colombia, core plugs at different experimental conditions.

The main difference identified between LPS and CDG systems is the viscosity behavior in the presence of Al(Cit)3. LPS reports a decrease in viscosities while CDGs shows an increase in viscosities in the presence of crosslinker. This difference is due to the use of different high MW HPAM polymers. However, the crosslinking of the trivalent ion (Al3+) and the negatively charged carboxylic groups of the polymer of both microgels occurs through intra-and inter-molecular interactions leading to different particle size or hydrodynamic diameter distributions (HDD). The rate and type of HDD is dependent of polymer and crosslinker concentration. These results were also compared with a CDG systems using Chromium Acetate (Cr(Ac)3) as a crosslinker used in Loma Alta Sur Field, Argentina. The crosslinkers used (Al3+ y Cr3+) forming CDG suggests similar crosslinking mechanisms but shows differences in HDD. However, the difference in the experimental conditions of studies documented makes difficult developing a more detailed comparison. Finally, the re-interpretation of CDG corefloods suggests that the main operating mechanisms include viscosity effects, adsorption, straining and log-jamming as proposed for LPS systems. However, viscosity effects and the gradual blocking of pore channels (log-jamming) seem to be more dominant in CDG than LPS systems. The results of this study will contribute with the understanding of the CDG’s and also provides guidance to improve the evaluation and research of the technology at lab scale.

Key words: CDG (Colloidal dispersion Gels), Polyacrylamide, Hydrodynamic Diameter Distributions, Microgels, Enhanced Oil Recovery (EOR).


Cita: Alzate, D., León, J.M., Cabrera, F. y Manrique, E. (2017). Evidences of CDG formation and possible interpretations of core flood studies. Revista Fuentes: El reventón energético, 15 (2), 31-47.

 DOI: http://dx.doi.org/10.18273/revfue.v15n2-2017003


EVIDENCIAS DE LA FORMACIÓN DE CDG Y POSIBLES INTERPRETACIONES DE PRUEBAS DE DESPLAZAMIENTO EN MUESTRAS DE NÚCLEOS


RESUMEN

La inyección de Geles de Dispersión Coloidal (CDG) ha sido evaluada exitosamente en diferentes países incluyendo Colombia. Sin embargo y a pesar del número de casos exitosos reportados en la literatura, estudios experimentales han generado controversias respecto a la posibilidad de inyectar altos volúmenes de CDG sin reducir la inyectividad y al mismo tiempo mejorar la eficiencia de barrido en el yacimiento.

Este trabajo resume brevemente la actualidad de la tecnología de microgeles, especialmente las Soluciones de Polímero Entrecruzadas (LPS) que también ha sido referenciado como CDG generando confusiones en la interpretación de ambos sistemas. Esta revisión también resume los mecanismos propuestos para la formación de LPS basados en estudios de interacciones fluido:fluido y durante su flujo en medios porosos. El presente estudio documenta por primera vez las evidencias de los posibles mecanismos de la formación de CDG utilizando una poliacrilamida parcialmente hidrolizada (HPAM) de alto peso molecular y Citrato de Aluminio (Al(Cit)3) como entrecruzador utilizando salmuera sintética del Campo Dina Cretáceos, Colombia, a condiciones ambiente (25°C). Los resultados obtenidos en este estudio fueron utilizados para re-interpretar pruebas de desplazamiento de inyección de CDG en muestras de núcleo de Berea y del Campo Tello, Colombia, a diferentes condiciones experimentales.

Se identifica que la principal diferencia entre el LPS y el CDG es el comportamiento de la viscosidad en presencia de Al(Cit)3. El LPS reporta una disminución de la viscosidad mientras que el CDG un aumento de la misma al interactuar con este entrecruzador. Esta diferencia se basa fundamentalmente en que estos sistemas se formulan con diferentes HPAM de alto peso molecular. Sin embargo, se identifica que el entrecruzamiento del ion trivalente (Al3+) y los grupos carboxílicos cargados negativamente del polímero ocurre de manera similar para ambos sistemas a través de interacciones intra- e inter-moleculares generando diferentes distribuciones de tamaño de partículas o diámetros hidrodinámicos (DDH). La velocidad de reacción y tipo de DDH resulta dependiente de las concentraciones de polímero y del entrecruzador. Estos resultados se comparan con sistema CDG formulado con Acetato de Cromo (Cr(Ac)3) como entrecruzador utilizado en el Campo Loma Alta Sur, Argentina. Los entrecruzadores empleados para formar CDG (Al3+ y Cr3+) sugieren mecanismos de interacción similares pero generan diferentes DDH. Sin embargo, las diferencias en las condiciones experimentales de ambos estudios dificultan establecer comparaciones más detalladas. Finalmente, la re-interpretación de pruebas de desplazamiento con CDG sugiere que los principales mecanismos de efectos de viscosidad, adsorción, restricción y divergencia del flujo resultan similares a los reportados para los sistemas LPS. Sin embargo, se estima que los efectos de viscosidad y de bloqueo de canales del medio poroso resultan más dominantes en los sistemas CDG respecto a los LPS. Los resultados de este trabajo contribuyen con el mejor entendimiento de los CDG y también sugiere guías para mejorar la evaluación e investigación de la tecnología a escala de laboratorio.

Palabras Claves: CDG (Geles de Dispersión Coloidal), Poliacrilamida, Distribuciones de Diámetros Hidrodinámicos, Microgeles, Recobro Mejorado de Petróleo.


INTRODUCTION  


porous media. CDG is one of several polymer microgel technologies that have been proposed for in-depth Colloidal     Dispersion Gels (CDG’s)      have been         conformance and potentially as mobility control method successfully tested in Argentina, China, USA, and most to improve sweep efficiency in waterfloods. Abdulbaki, recently in Dina Cretáceos Field, Colombia (Manrique,      Huh, Sepehrnoori, Delshad & Varavei (2014) recently et al., 2014). However, questions remain regarding        reported a literature review of different polymer the mechanisms operating during the CDG flow in the     microgel technologies (Table 1).

Table 1. Summary of polymer microgel technologies discussed by Abdulbaki, et al., (2014).

Technology       Gelation   At Surface Trigger     In-Situ     Particle Size Before      Particle Size After

CDG

Preformed CDG PPG

BrightWater

In-situ

Preformed

Polymer & crosslinker Microgel

Particle Gel

Microgel

Transition Pressure

Temperature

Swollen microgel

Swollen particle gel

Swollen microgel

nm to µm

µm to cm

0.1-1 µm

µm

20-200  larger

1-10  µm

pH-sensitive


pH


µm

Up to 1,000 larger

PPG = Preformed Particle Gels


Abdulbaki, et al. (2014) also provided a summary differentiating polymer flooding, polymer in-situ gel flooding and polymer microgel flooding technologies. However, this review does not differentiate Linked-

Polymer Solutions (LPS) and CDG technologies leading to misinterpretations of both systems. Before describing the main differences of LPS and CDG it is important provide a basic definition of these systems. LPS and CDG are linked polymer solutions with properties like colloidal solutions. Both systems are formed due to intra- and inter-molecular interactions of low concentration of high MW HPAM and Al(Cit)3 as the crosslinker. However, the viscosity and size distributions of LPS and CDG show important differences that will be summarized in this section.

Aarra, et al. (2005) referred indistinctly in-depth mobility control systems as LPS or CDG that are formed with low concentration of partially hydrolyzed polyacrylamide polymer cross linked with aluminum citrate (Al(Cit)3). However, detailed reviews of LPS studies confirmed that these systems are formed with SNF Flopaam 3630 (High MW HPAM) and Al(Cit)3 (Bjorvisk, Hoiland, & Skauge, 2008) (Bolandtaba & Skauge, 2011) (Selle et al., 2013) (Skauge, Hetland, Spildo, Skauge & Cipr, 2010) (Skauge, Djurhuus, Hetland, Spildo & Skauge, 2011)generated by a crosslinking reaction between aluminium and partially hydrolyzed Polyacrylamide (HPAM (Spildo, Skauge, Aarra & Tweheyo, 2009) (Spildo, Skauge & Skauge,

2010). This represents the first difference with CDG systems that are formed with a different high MW HPAM commercially available. Romero (2009) reported the effects of polymer type on the formation of CDG in glass beads porous media.

The second difference found between these two systems is that LPS viscosities are lower than the polymer solution at the same concentration (Bjørsvik, Høiland & Skauge, 2008) while CDG viscosities are higher in the presence of Al(Cit)3 compared to the polymer solution at the same concentration (Alzate, 2016). This is also valid for CDG systems prepared with Chromium Acetate (Diaz, et al., 2015).

Despite the differences between LPS and CDG systems, it is important to remark that LPS studies documented in the literature reported new insights for the re-interpretation of possible mechanisms of

CDG formation and its flow in porous media. A brief summary of the main findings reported during research studies of LPS systems are listed below:

LPS have properties similar to simple colloidal solution with particle size in the order of 20-150 nm (Aarra, et al., 2005) (Bjorvisk et al., 2008) ( Bolandtaba & Skauge,  2011).

The initial crosslinking reaction is fast and takes several days to complete the reaction. The crosslinking of trivalent ions (i.e. Al3+) and negatively charged carboxylic groups of the polymer occurs through intra- and inter-molecular interaction and its combination (Bjorvisk et al., 2008) ( Spildo, et al.,  2010).

LPS can propagate in porous media and increase oil recoveries (Spildo, et al., 2009) (Spildo, et al., 2010) ( Skauge, et al.,  2010).

Main mechanisms reported during LPS injection include viscosity effects, adsorption, straining and log-jamming. The microscopic diversion caused by gradual blocking of pore channels (caused by the log-jamming mechanism) leads to diversion of local flow mobilizing trapped oil. The effects of the proposed mechanisms on the water relative permeability represent a balance between the degree of blocking and the amount of produced oil ( Bolandtaba & Skauge,  2011).

Based on the experienced gained evaluating LPS systems, this work is aimed at evaluating the CDG system injected in Dina Cretáceos Field, Colombia. This study will use the chemicals injected in the field and prepare the CDG in synthetic brine to determine the effects of polymer concentration and polymer:crosslinker ratio on the viscosity and size distribution over time. The results of these experiments will be used to interpret different coreflood studies developed to support the CDG injection in Dina Cretáceos and Tello Fields, Middle Magdalena Valley, Colombia.

EXPERIMENTAL TESTS

Diaz, et al., (2015) reported for the first time the size distribution of CDG agglomerates formed during the interaction of high molecular weight (MW) partially hydrolyzed polyacrylamide (HPAM) polymer and Chromium Acetate (Cr(Ac)3). To further expand the understanding of CDG systems, Alzate (2016) developed a study evaluating the formation of CDG at lab scale using the same HPAM and Aluminum Citrate (Al(Cit)3) as the crosslinker (CLX). Specifically, this paper will summarize the effects of HPAM and CLX concentration on the rheology and HDD of CDG agglomerates formed over time.

Materials

To prepare the polymer and CDG solution synthetic water of Dina Cretaceous Field was used. Dina synthetic water consists in NaHCO3 (0.99 g/L); NaCl (6.07 g/L); Na2SO4 (0.01 g/L); CaCl2*2H2O (1.02 g/L); MgCl2*6H2O (0.52 g/L); BaCl2 (0.02 g/L); FeCl3*6H2O (0.03 g/L); Sr(NO3)2 (0.02 g/L); and KCl (0.10 g/L). The polymer was an HPAM (Nalco®EOR-370) with a high MW (18-21 million Dalton) and a 30% hydrolysis. The Aluminum Citrate (Nalco®EOR-677N) was chosen as the CLX. The CDG solutions were prepared from a polymer stock solution of 2,000 ppm and a CLX stock solution of 1,000 ppm. The polymer was dispersed in the synthetic water and was mixed using a magnetic stirrer at low speed (125 RPM) for approximately 12 hours (overnight). The CLX was mixed in synthetic water to ensure its complete dissolution. It is important to mention that all CDG systems prepared did not consider the use of oxygen scavengers due to the low temperature (25°C) and short evaluation times (≤ 7 days) of the experiments.  Table 2 summarizes the CDG systems prepared using the stock solutions of HPAM and CLX. Polymer concentrations and P:CLX ratio selected for this study are within the range of the CDG system injected in Dina Cretáceos Field (Castro, et al., 2013).

Table 2. CDG Samples.

Polymer

Polymer –

Samples        Concentration

Crosslinker Ratio

(ppm)

Crosslinker

Concentration

( ppm )

1       Polymer Base Line

400


2    40:1

400

10.00

3    40:1

600

15.00

4    40:1

200

5.00

5    20:1

400

20.00

6    60:1

400

6.67


Rheological and Hydrodynamic

Diameter Measurements

Rheological measurements were performed using a Fungilab – Alpha Series rotational viscometer. All viscosity measurements were carried out a room temperature 25°C.

The Dynamic Light Scattering (DLS) method was used to measure (NanoPlus – Zeta potential and Nano Particle Analyzer) the hydrodynamic diameter of the polymer and CDG systems. The hydrodynamic size measured by the DLS can be defined as “the size of a hypothetical hard sphere that diffuses in the same way as the particle being measured” (Instruments, 2011). However, the particles or macromolecules in solution are dynamic and non-spherical. Therefore, the calculated diameter from the particle diffusion properties will be an indicative of the apparent size of the dynamic particle.

The measurement principle of the DLS is based on the Brownian motion that affects the particles dispersed in solution (Systems, 2012). The intensity and speed of this vibrational movement depend on the temperature and the viscosity of the liquid. High temperature means more movement. If the liquid contains a particle, that particle receives the constant impacts of the molecules of the liquid. The vibrational velocity of this particle also depends of its own size but the density and mass of the particle have no influence (Nelson, 1967). The Stokes-Einstein equation describes the dependence between the speed of the movement and the size of the particles. Equation (1) presents the Stokes-Einstein relation to calculate the particle size taking into account that the DLS method measures the diffusion coefficient and not the movement speed (Kaszuba, McKnight, Connah, McNeil-Watson, & Nobbmann, 2008):


Where d is hydrodynamic diameter, K is the Boltzman constant, T is the temperature, µ is the viscosity of the solvent and D is the diffusion coefficient.

The DLS results are presented as diameter size distribution respect to the differential intensity. The intensity distribution is weighted according to the scattering intensity of each particle fraction or particle family. This distribution may represent either a small amount of agglomerated particles or a large particle.

As described in the equation (1), DLS measurement is affected by the viscosity of the liquid. In the present study the viscosity value measured at the lowest shear rate (10 rpm) was used as a reference for measuring the hydrodynamic diameter of the CDG systems. It should be noted that CDG or polymer solutions were not subjected to any degradation process before the measurement of their hydrodynamic diameter. The viscosity as a function of the shear rate and the hydrodynamic diameter of the CDG systems were evaluated at 0, 1, 3, 5, and 7 days after its preparation. All tests were performed at room temperature.

RESULTS AND DISCUSSION

This section of the paper summarizes the results of CDG viscosities and HDD (size) over time at different polymer concentrations and polymer:crosslinker (P:CLX) ratios reported by Alzate (2016). The results of this study will be used to re-interpret corefloods run in Berea core plugs injecting CDG (using Al(Cit)3 as a crosslinker) and Dina Cretáceos Field fluids (Castro, et al., 2013) (Manrique et al., 2014). Based on the similarities of CDG viscosities and HDD using Al(Cit)3 (Alzate, 2016) and Cr(Ac)3 (Diaz, et al., 2015), corefloods run in Tello core plugs injecting CDG (using Cr(Ac)3 as a crosslinker) will be also discussed. The re-interpretation of corefloods discussed in this paper will also consider the evaluation of the proposed mechanisms for the LPS systems (Bolandtaba & Skauge, 2011).

Viscosity and size distribution of CDG system

Figure 1 shows the CDG viscosity as a function of polymer concentration (200, 400 and 600 ppm) and time for a constant P:CLX ratio of 40:1. The black line represents the viscosity of the 400 ppm polymer solution in absence of crosslinker (Al(Cit)3). It should be noted that CDG viscosity increases with time and polymer concentration compared to the polymer solution at 400 ppm. As can be seen in Figure 1, the CDG system prepared with the HPAM solution of 200 ppm and

P:CLX of 40:1 reaches a viscosity of approximately 75cp at the seventh day of evaluation while the viscosity of the HPAM solution at 400 ppm remains constant at about 11cp. This demonstrates that CDG can achieve higher viscosities with less polymer concentration than polymer solutions. The reported viscosity measurements have a precision of ±0.1cp with a repeatability of 0.2%.

The viscosity behavior showed in Figure 1 is different from that reported in the LPS systems evaluated by Bjørsvik, et al. (2008) showing a decrease in viscosity over time. In addition, all the LPS systems evaluated presented a viscosity reduction immediately after the addition of the crosslinker agent.
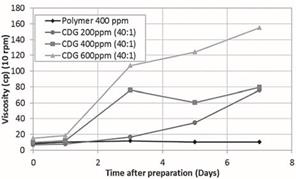
Figure 1. CDG Viscosity as a function of polymer concentration and time at constant polymer: crosslinker ratio (40:1).

Figure 2 shows the viscosity as a function of shear rate and time for the CDG system of 400 ppm and P:CLX of 40:1. The viscosity of the CDG systems after 1 day of its preparation is practically the same of the CDG freshly prepared (Day 0). However, the viscosity significantly increases after one day of interaction. CDG viscosity continue increasing with time suggesting that the chemical interaction between the HPAM and the crosslinker (Al(Cit)3) occurs at low reaction rates and take place with time. Additionally, CDG systems evaluated shows a Non-Newtonian fluid behavior, where its viscosity depends on shear rate (Figure 2). This behavior is also similar for the LPS systems evaluated by Bjørsvik, et al. (2008).
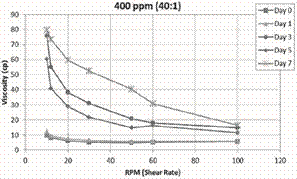
Figure 2. CDG (400ppm & 40:1) viscosity as function of shear rate and time.

The HPAM solution of 400 ppm and the CDG system (400 ppm and P:CLX ratio of 40:1) were selected to evaluate the HDD over time. The HDD for the HPAM solution shows small variation over time. The HPAM solution only develops a unimodal diameter distribution that is practically constant in the time. The D50 is about 33.5 nm, and the particles size distribution is between 1.5 to 670 nm (Figure 3). On the contrary, the CDG systems evaluated at the same polymer concentration shows a high variability of the HDD after 1 day of interaction (Figure 4, Figure 5 and Figure 6). Figure 4 compares the HDD of the HPAM solution of 400 ppm and the CDG system freshly prepared (at Day 0) at the same polymer concentration and a P:CLX of 40:1. It can be noticed the similarity between both distributions suggesting the slow interaction between the polymer and the crosslinker to form the CDG agglomerates. This observation is contrary with the fast initial crosslinking reaction reported for LPS systems. However, both systems (CDG and LPS) requires several days to complete the reaction (Bjorvisk, et al., 2008) (Spildo, et al., 2010).

However, after the first day of the preparation the

CDG solution the HDD shows a well-defined trimodal distribution indicating particles or agglomerates with average diameters of 1.5 nm, 20 nm and 410 nm, respectively (Figure 5). Therefore, the range of the size distribution increased from 2-380 nm (Day 0) to 1.5- 690 nm (Day 1). The mean peak of 20 nm (dashed red line) can represent the HPAM molecules which probably have not started its interaction with the crosslinker. The peak observed at 410 nm can be interpreted as the formation of larger aggregates or larger structures than the conventional HPAM. Finally, the peak registered at 1.5 nm suggests the formation of small molecules (or colloids) representative of intra-molecular interactions. These results are in agreement with the crosslinking mechanisms of LPS systems that occurs through intra- and inter-molecular interaction and its combinations as proposed by Bjorvisk, et al. (2008) and Spildo, et al. (2010).

Figure 6 presents the HDD of the CDG system (400 ppm and P: CLX of 40:1) from day 0 to day 7. It can be clearly noticed the strong presence of the 3 welldefined peaks after 3 days of interaction compared with diameter distributions reported for days 0 and 1. The three peaks correspond to average values of 1.1 nm, 9 nm and 150 nm after 7 days of evaluation.  It is remarkable two characteristics of these trimodal distributions: the diameter size range of the CDG system decreases over the time and the high intensity measured for the particles with an average diameter of 1.1 nm. The differential intensity for the particles in the range of 1.1 nm is around 30 to 40% of the cumulative intensity of the sample. The particles in the range of 9 nm represent about 48% and the cumulative intensity of the largest particles (peak @ 150 nm) is about 10 to 15%. This result suggests that the intramolecular interactions are dominant in the formation of CDG and entail the formation of small agglomerates or colloids. However, these results needs to be further investigated due to possible uncertainties associated to the measurements of particles below the 1 nm range.
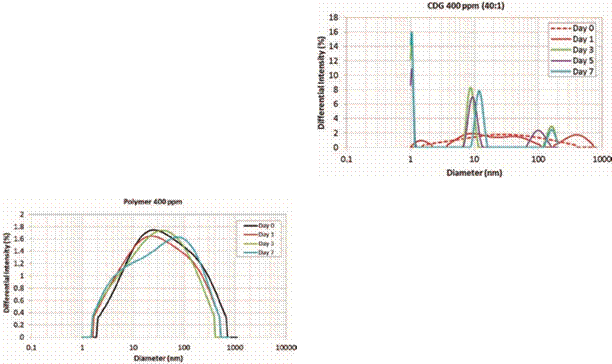


Figure 3. Hydrodynamic Diameter as function of time – Polymer 400 ppm.
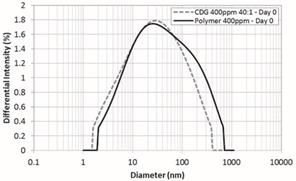
Figure 4. Hydrodynamic Diameter at Day 0 – Polymer 400  ppm and CDG 400 ppm –  40:1
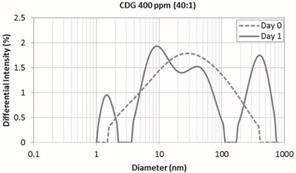
Figure 5. Hydrodynamic Diameter at Day 0 and 1.

CDG 400 ppm – 40:1

Figure 6. Hydrodynamic Diameter as function of time. CDG

400  ppm –  40:1


Figure 7, Figure 8, Figure 9 and Figure 10 shows the HDD of CDG systems as function of polymer to crosslinker (P:CLX) ratio, polymer concentration and time. The CDG system prepared with Dina Cretáceos Field synthetic brine, HPAM solution of 400 ppm and P:CLX of 20:1 was selected for evaluation. This system is the closest to the CDG injected in Berea corefloods that will be discussed in the next section of this paper. This CDG system shows three regions from the first day of measurements, where their modal peaks correspond to 1.4, 30 and 450 nm, respectively (Figure 7). This behavior differs from the observed for the CDG of 400 ppm and P:CLX of 40:1 presented in

Figure 5 exhibiting a unimodal trend at Day 0 similar to the polymer solution in absence of Al(Cit)3. This result suggests that an increase in the concentration of the crosslinker accelerates the formation of agglomerates. As the time of reaction progress, three regions are completely demarcated by their intensities for the days 3 and 5 (Figure 8). These peaks are identified around 1 nm, 8 to 11 nm and 100 to 160nm, respectively. However, for the day 7 a well-defined bimodal distribution is observed with peaks at 1 nm and 24 nm (solid blue line). The particles in the range of 1 nm correspond to 56% of the sample analyzed. Regardless the possible uncertainties associated to the measurements of the hydrodynamic diameters in the range or below 1 nm, these results demonstrates the effects of higher concentrations of crosslinker on the formation of CDG agglomerates which seems to be dominated by intra-molecular interactions. This can be also observed in the hydrodynamic diameter of CDG’s prepared with a HPAM solution of 400 ppm at different P:CLX ratios as shown in Figure 9. The sample with the highest concentration of crosslinker (20:1) shows a less dispersed distribution at day 7 of evaluation (solid red line); where unlike samples with P:CLX of 40:1 and 60:1 the largest particles disappear.

The effect of polymer concentration at a constant P:CLX (40:1) on the HDD distribution is depicted in Figure 10. The polymer concentration also affects the formation of the CDG particles with time. At early stages of interaction (day 0) the increase in polymer concentration (from 400 to 600 ppm) and the same P:CLX (40:1) accelerates the intra- and inter-molecular interactions. This behavior was also observed with the increase of crosslinker concentration (Figure 7). As the reaction time progress in the CDG system with the higher polymer concentration (600 ppm) shows a different trend  of the hydrodynamic diameter than the CDG’s with lower polymer concentrations (200 and 400 ppm) at the same P:CLX (40:1). After seven days of interaction, the agglomerates of larger size (>100 nm) disappears for the CDG system (solid purple line) prepared with 600 ppm of polymer (Figure 10). This trend was also observed with the increase of the crosslinker concentration at the same polymer concentration of 400 ppm (Figure 9).
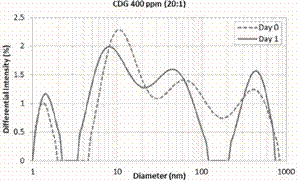
Figure 7. Hydrodynamic Diameter at Day 0 and 1. CDG 400 ppm – 20:1
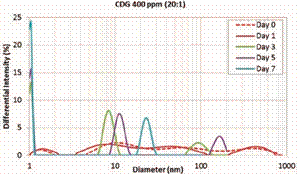
Figure 8. Hydrodynamic Diameter as function of time. CDG 400  ppm –  20:1
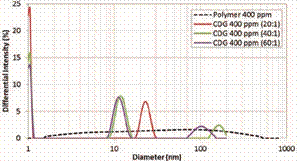
Figure 9. Hydrodynamic Diameter as function of crosslinker concentration – Day 7.
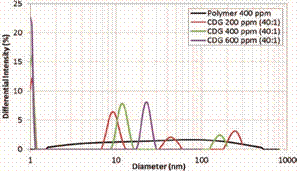
Figure 10. Hydrodynamic Diameter as function of polymer concentration – Day 7.

Based on the results observed evaluating the HDD of CDG systems prepared with HPAM polymer and

Figure 11. Schematic representation of a HPAM molecule and intra- and inter-molecular crosslinking with Aluminum (crosslinker).

Al(Cit)3 suggests that the initial reactions occurs through intra- and inter-molecular interactions (Figure 11). This is consistent with the crosslinking of Al3+and negatively charged carboxylic groups of the polymer of LPS systems proposed by (Bjorvisk, et al., 2008) (Spildo, et al., 2010). The reaction rates of CDG systems also suggest to be influenced by the polymer and crosslinker concentrations. The higher the concentration the faster the formation of agglomerate structures of different sizes. Additionally, as the reaction times increase the formation of CDG systems seems to be dominated by intra-molecular forming structures (or colloids) of smaller size. This effect becomes more evident as the polymer and crosslinker concentration increases. It is worth to mention that the HDD observed for different CDG systems (Figures 6, 8 and 9) shows that the agglomerates formed are of smaller diameter than the polymer solution in absence of crosslinker. This smaller HDD can be consider as a factor that may limit the importance of the microscopic diversion (log-jamming) effects as suggested in the literature (Bolandtaba & Skauge, 2011). However, the microscopic diversions should be interpreted as a gradual blocking due to mechanical entrapment of agglomerates (mud filter cake type) as it will be presented later in this paper.


Finally, the results of this study demonstrates the complexity of CDG systems in static fluid:fluid interactions of HPAM polymer and Aluminum Citrate (Al(Cit)3) at room temperature (Alzate, 2016). These interactions are expected to be more complex in the porous media due to multiple effects (i.e. polymer shear degradation, chemical adsorption, chemical additives used in water treatment, presence of crude oil, etc.) that can impact the formation of CDG in-situ and its flow in the reservoir. Therefore, greater efforts and more detailed research studies will be required to generate a better description and understanding of

CDG systems at different experimental conditions. The evaluation of HDD combined with the pore and pore throat size distributions of core/rock samples (from capillary pressure data or the analysis of rock images) will represent an important improvement of existing experimental protocols at specific reservoir conditions for the design of CDG injection as mobility control and/or in-depth conformance strategies in waterfloods. The following sections of this paper will attempt to re-interpret coreflood studies injecting CDG under different conditions based on the new findings reported by Diaz, et al., (2015) and Alzate (2016).

INTERPRETATION OF CDG INJECTION IN BEREA CORES

Due to the lack of availability of core material for

Dina Field, the corefloods developed to support the evaluation of CDG was performed using Berea core plugs. First studies of CDG injection to evaluate the technical feasibility of CDG in Dina Field were run using slim tubes (sand packs). This study demonstrated the reduction of slim tube pore volumes due to the injection of CDG. Changes in pore volume were estimated from tracer injection before and after the injection of CDG (Castro, 2011). The results of this investigation are in agreement with the blocking mechanism proposed by Bolandtaba & Skauge (2011).

To evaluate the propagation and incremental oil recoveries of CDG injection, this work will discuss two Berea corefloods summarized by Castro, et al. (2013). These corefloods considered a similar experimental procedure reported by Spildo, et al. (2009 & 2010). Specifically, the main objectives was to compare the performance of CDG injection freshly made and after aging it for one week, as reported in LPS injection in Berea core plugs. Additionally, same polymer concentration (600 ppm) and P:CLX ratio of 20:1 (using Al(Cit)3 as a crosslinker) was used in the experiments developed as part of the support of Dina Field pilot project.

Berea core plugs used were 1.5 in. diameter and 6 in. long (Cut 1-ft long Berea core plug in two) with air permeabilities of 2 Darcy and a porosity of 23%. Table

3 summarizes core properties used in these experiments. Dina synthetic brine and dead oil (8.7 cp) were used as reservoir fluids. Both tests were run at room temperature (25°C) and with a confining pressure of 450 psi. Coreflood protocol followed standard procedures saturating the sample with brine (Permeability to brine or KBrine) and continue with crude oil injection until reaching irreducible water saturation (Swi). Waterflooding started until reaching irreducible oil saturation to oil (Sorw) at different injection rates (1-3 cc/min). The system was stabilized at an injection rate of 1cc/min before CDG injection began.

Approximately, 6.4 PV of CDG was injected (at Sorw) followed by brine injection. As mentioned before, CDG injected consisted in a solution of 600 ppm of HPAM with a P:CLX ratio of 20:1. The first coreflood was run injecting a CDG freshly made (12-15 cp @ 10s-1) and in the second coreflood, the CDG was aged for one week (130-140 cp @ 10s-1) before its injection.

Figure 12 shows incremental oil recoveries and differential pressures recorded in both corefloods. The injection of CDG freshly made (Figure 12a) showed better oil recoveries and lower differential pressures than the injection of one week aged CDG (Figure 12b). The differences observed in the differential pressures recorded in both corefloods can be explained based on the increase in viscosity (showing similar trends than the CDG systems presented in Figure 1 and Figure 2) and the more defined HDD over time (Figure 7 to Figure 10) of the CDG systems injected (freshly made vs. aged 1 week).


Figure 12. Oil recoveries and differential pressure recorded during CDG injection in Berea core plugs: freshly made (a) and aged for one week (b)

Table 3. Summary of Berea core plugs used in CDG injection reported by Castro, el at. (2013)

rameter

Coreflood 1

Coreflood 2

Length

5.96” (15.14 cm)

5.94 ” (15.09 cm )

Diameter

1.48” (3.76 cm)

1.48 ” (3.76 cm )

Bulk Volume

168. 10 cc

167.20  cc

Pore Volume

38.61 cc

39.48  cc

Porosity

0.23

0.24

Brine Permeability

2,123 mD

2 ,089 mD

Swi

0.2

0.2

Sorw

0.4

0.4


In both corefloods the analysis of polymer and Aluminum (Al) production was also performed. Based on ratio of polymer and Al production in the effluents, it can be concluded that CDG can propagate in the porous media as reported during the injection of LPS systems in Berea core plugs (Spildo, et al., 2010). However, the ratio of polymer and Al produced differs from the reported during LPS injection and it strongly dependent on the

CDG system injected (Figure 13). For the coreflood injecting CDG freshly prepared, the ratio of Al and HPAM produced requires larger pore volumes (PV) to reach a constant polymer-to-Al ratio (Figure 13a) than the CDG injected after aging it for one week (Figure 13b). These results clearly suggest that during the injection of

CDG freshly made there is a chromatographic separation (Figure 13a) at early stages of the experiment due to the following mechanisms but not limited to:

Higher polymer production vs. Al (compared with the injected ratio) at early stages of the coreflood is influenced by the inaccessible PV of the Berea core plug and lower adsorption of the HPAM compared to AlCit.

Al production profile suggests that there is a high chemical adsorption at early stages of the coreflood and after approximately 3 PV of chemicals injected the CDG’s are produced at a constant polymer-to-Al ratio. This high chemical adsorption at early stages

of injection limits the formation of CDG in-situ until a threshold concentration of Al(Cit)3 is available to interact with the polymer solution present in the porous media. In other words, during CDG injection the first volumes of chemicals injected can be considered as a sacrificial fraction until the CDG’s can be formed in-situ. The proposed mechanisms explains the characteristics of pressure build-up response observed in several CDG projects (Manrique, et al.,

2014). This will be also addressed in a coreflood run in Tello core plug to be discussed later in this paper.

Figure 13. Polymer and Aluminum concentration as a function of the PV of chemicals injected in Berea core plugs at Sorw:

CDG freshly made (a) and pre formed CDG aged for one week (b)

Figure 13a also depicts the pictures of the Berea core plug used in this experiment (Coreflood 1) before and after the injection of CDG freshly made suggesting no major formation damages due to the flow of CDG through the porous media. However, for the experiment (Coreflood 2) injecting pre-formed CDG after aging it for one week a severe front end loading (face plugging) can be observed (Figure 13b). This behavior explain the lower oil recoveries and higher differential pressures recorded in this experiment compared with injection of CDG freshly made as described earlier in this section (Figure 12). The results of these corefloods represent a good example showing the differences between LPS and CDG systems. Spildo, et al., (2010) reported that LPS (aged for one week) propagated through Berea corefloods run at similar experimental conditions with no detectable front end loading validating the differences of both microgel systems.

Regarding the interpretation of the coreflood injecting a CDG system after aging it for one week, the produced polymer-to-Al ratio shows a completely different profile than the observed for the coreflood injecting CDG freshly made (Figure 13). In this experiment (coreflood 2), the ratio of chemicals produced is influenced by the front end loading observed in the core plug (Figure 13b). Based on the ratio of the chemicals (HPAM &

Al) produced in coreflood 2 and the HDD as a function of crosslinker and polymer concentration after 7 days

(Figure 9-Figure 10), the filtration of CDG agglomerates of higher hydrodynamic diameter (i.e. >100 nm) can explain the severe front end loading. However, CDG agglomerates of smaller hydrodynamic diameter (i.e. <100 nm) can propagate through water-wet Berea core plugs with no chromatographic separation at different injection rates (1-3 cc/min). However, it is important to mention that the CDG’s produced are at reasonably constant polymer-to-Al ratio but generally at a higher ratio (≈25:1 to 40:1) than the injected system (20:1).

Finally, the injection of tracers before and after the injection of CDG (Freshly made vs. aged for 1 week) was also considered to further support the interpretation of both Berea corefloods. Tracer injection was performed using the same injection rates (2 cc/min) and tracer concentration (2,000 ppm of NaBr). Figure 14 shows tracer elution before (at Sorw) and after the CDG injection. Comparing tracer (Bromine concentration) production profiles of both tests (Freshly made vs. aged for 1 week) clear differences can be noticed. For the test injecting CDG freshly made the reduction of the PV of the Berea core plug can be inferred based on the faster tracer breakthrough (Less contacted PV). Tracer profile also suggests a larger dispersion than the observed at Sorw (Figure 14a). These results and incremental oil recoveries (14.6% of the OOIP) observed after the

Figure 14. Tracer profiles before (at Sorw) and after CDG injection: CDG freshly made (a) and CDG aged for one week (b)

CDG injection (Figure 12a) confirms that the main mechanisms proposed for LPS (Bolandtaba & Skauge, 2011) also applies for CDG being the viscosity effects more important for CDG. Regarding the reduction of PV (Figure 14a) and the increase in the differential pressures observed (Figure 12a) after the injection of approximately 6.4 PV CDG freshly made suggests the microscopic diversion caused by the gradual blocking of pore channels (log-jamming mechanism) leading to diversion of local flow mobilizing trapped oil as reported by (Bolandtaba & Skauge, 2011).


Comparing the tracer profiles of coreflood 2 (CDG injection after aging it for one week) it can be noticed that there is almost no difference in the tracer elution profiles (Figure 14b). This result can be explained by the severe front end loading (CDG filtrate), lower oil recoveries (4.6% of the OOIP) and higher differential pressures (Figure 12b and Figure 13b) observed in this test. In this coreflood, all the blocked pore channels by the injection of pre-formed CDG occurred in a small fraction of the core plug PV which explains the small difference of both tracer profiles. The CDG agglomerates of smaller hydrodynamic diameter (i.e. <100 nm) that propagated during the test (Figure 13a) suggests that the blocking effects of pore channels was not enough to generate the flow diversion and hence mobilize trapped oil as observed in coreflood 1 (Figure 12a). However, the validation of the mechanisms inferred in these corefloods must be confirmed through more detailed experiments including fluid:fluid and fluid:rock studies using the same systems and experimental conditions. The comparison of core pore size and HDD and evaluation of the hydrodynamic diameter of CDG produced is also recommended.

INTERPRETATION OF CDG INJECTION IN TELLO CORE PLUGS

Figure 15. Polymer and CDG viscosity and size distributions vs. time for a CDG system with Chromium Acetate (HPAM 300 ppm; P:CLX 40:1 and T = 42°C) injected in Loma Alta Sur, Argentina (Diaz, et al., 2015)

CDG technology was also evaluated in Tello Field, Colombia (León, et al., 2015). This project was supported by different laboratory studies including several corefloods using reservoir fluids and rock. The following section will summarize and re-interpret some of the tests performed based on the HDD of CDG systems described in the previous section of this paper. All Tello corefloods were run with a CDG system using Cr(Ac)3 as the crosslinker. Hence, the reinterpretation of Tello corefloods will be also supported with the CDG size distributions observed in the CDG systems injected in Loma Alta Sur, Argentina (Figure 15) (Diaz, et al., 2015). It is important to mention that the experimental conditions of the studies reported for Loma Alta Sur differs from those used in Tello corefloods. However and based on the similar trends in CDG viscosities and hydrodynamic diameter (size) distribution using Al(Cit)3 (Alzate, 2016) and Cr(Ac)3 (Diaz, et al., 2015), the authors of this paper considers valuable this evaluation providing new insights that can contribute the design and interpretations of CDG and other microgel technologies.


Figure 15 shows an example of polymer and CDG viscosity (Brookfield dynamic viscosity) and size distributions (Malvern Nanosizer S) over time using a polymer concentration of 300 ppm, P:CLX ratio of 40:1 at 42°C (Diaz, et al., 2015). Viscosity trends of this system is very similar than the observed for the CDG system of 400 ppm and P:CLX of 40:1 using Al(Cit)3 as a crosslinker (Figure 2). The differences in viscosities of both CDG systems (Al(Cit)3 vs. Cr(Ac)3) can be attributed to the differences in experimental conditions and methods used, among others. However, it is clear that CDG generates higher viscosities compared to the polymer solution at the same concentration in absence of crosslinker. Regarding the size distributions (Figure 15), it can be inferred the presence of intra-molecular (smaller size distributions) and inter-molecular (large size distributions) interactions compared with the polymer solution (dashed light blue line). These results are consistent with the crosslinking mechanisms proposed for LPS systems. However, the formation of larger aggregates (≈1 micron) suggests that CDG’s used in Loma Alta Sur are dominated by intermolecular crosslinking and/or a combination of intra/ inter molecular crosslinking (Spildo, et al., 2010). It is important to mention that the size distributions observed with Cr(Ac)3 are higher (Figure 15) than those measured with Al(Cit)3 (Figure 8, Figure 9 and Figure 10). However, these differences will not be discussed in this paper.

Evaluation of the injection scheme of HPAM and crosslinker in single phase corefloods.

The coreflood program for Tello Field start comparing the injection schemes of HPAM and crosslinker (Cr(Ac)3). The concept of reservoir permeability correction using sequential injection of polymers and multivalent metal ions solutions (i.e.: Al(Cit)3 and Cr(Ac)3) was originally patented by Gall (1973). This technology was commercially tested in 1980 at North Burbank Unit, OK (Moffit, Zornes, Moradi-Araghi & McGovern, 1990). This field application evaluated different strategies including the sequential injection of polyacrylamide solutions and crosslinking solutions (AlCit or Chromium Propionate). However, due to injectivity constraints reported during the sequential injection of polymer and crosslinker, the injection strategy was changed by mixing both chemicals at the wellhead (Manrique et al., 2014). Therefore,

Figure 16. Effect of the injection scheme of HPAM and Cr(Ac)3 on polymer production in Tello corefloods (Figure also shows the setup used for the co-injection of both chemicals)

Tello coreflood study start comparing the sequential injection vs. the co-injection of chemicals in brine saturated (single phase) core plugs. These experiments will provide information regarding the injectivity of polymer and crosslinker in Tello reservoir rock. Three corefloods were run using Tello core plugs saturated in Tello synthetic brine at room temperature (25°C). Core permeabilities used in these tests ranged from 122 to 269 mD. For the sequential (layered) injection tests, the concentration of HPAM polymer and crosslinker (Cr(Ac)3) used was 600 ppm and 30 ppm, respectively. For the co-injection of both chemicals (CDG formation in-situ) the same concentrations using a P:CLX ratio of 20:1 was considered. Figure 16 shows the results of polymer production for all three experiments and the setup used to co-inject HPAM and crosslinker to promote the CDG formation in-situ (both chemicals are mixed in the core plug).


The interpretation of the polymer production observed in Tello corefloods using different injection schemes (Figure 16) is summarized below:

Test 1: This test start injecting several PV of polymer followed by the injection of ≈3 PV of crosslinker (Cr(Ac)3) and Tello synthetic brine until the differential pressures are stabilized. Comparing the polymer production, this test shows the fastest polymer breakthrough. This result is expected and can be attributed to the low adsorption of HPAM in Tello reservoir rock (0.18 mg/g rock) and inaccessible PV (Sorbie,

1991) not reported in these experiments. The RRF reported in this experiment was 25 suggesting that the formation of CDG in-situ in a rock saturated by polymer is somehow limited due to a possible lower availability of charged carboxylic groups to interact with the crosslinker. However, this will require more detailed experiments to validate this hypothesis.

Test 2: This coreflood is similar to test 1 but starting with the injection of crosslinker. In this test polymer production is delayed with respect test 1.

this test) and its interaction with the HPAM once the core plug is fully saturated with Cr(Ac)3. This experiment reported the highest RRF (≈167) of all three experiments. This result suggests that there is an excess of chromium available to interact with the front of polymer injected allowing the formation of CDG in-situ.

Test 3: During the co-injection of chemicals polymer breakthrough occurs in between the corefloods using sequential injection (Tests 1 and 2) suggesting the formation of CDG in-situ despite the competition for adsorption sites in Tello reservoir rock. This result is also consistent with the chromatographic separation observed during the injection of CDG freshly made in Berea core plugs (Figure 13a). This

test considered the injection of approximately 23 PV of chemicals but the results will be discussed in further details in the next section.

All these tests included the injection of tracer (NaBr) before and after the injection of chemicals (HPAM & Cr(Ac)3) to evaluate changes in core plug PV. Tracer data confirmed the reduction of 15-20% of the PV after the sequential injection or co-injection of HPAM and crosslinker. Calculations of PV changes were based on the Methods of Moments - MoM (Shook, Pope, & Asakawa, 2009). The reduction of PV observed in Tello core plugs is consistent with the results obtained in

Berea corefloods described in the previous section of the paper (Figure 12, Figure 13 and Figure 14) and is in agreement with the gradual blocking of pore channels (log-jamming mechanism) proposed by Bolandtaba & Skauge (2011).

Evaluation of changes in injection rates and P:CLX ratio during the co-injection of HPAM and crosslinker.

CDG injection projects are generally managed by adjusting the injection rates, polymer concentration and/or P:CLX ratios (Manrique et al., 2014). For this reason, the coreflood co-injecting HPAM and Cr(Ac)3 summarized in the previous section (Test 3) was used to demonstrate the injection of large volumes of CDG varying key variables used during the operation of CDG field projects. The results of this test were described by León et al., (2015). However, in this paper the results of this coreflood will be revisited including the recent findings describing the formation of agglomerates due to intra- and inter-molecular interactions observed in CDG systems (Diaz, et al., 2015) (Alzate, 2016).

Figure 17 shows the differential pressure and polymer production history during the injection of approximately 23 PV of CDG in a brine saturated Tello core plug (K

= 269 md) under different experimental conditions. The co-injection of chemicals was decided to validate the formation of CDG in-situ due to the interaction of HPAM and Cr(Ac)3 in the porous media. The setup used for the co-injection of chemicals is shown in Figure 16 (Promote the formation of CDG in-situ similar to field operations where the chemicals are co-injected and mixed at the wellhead). In this test each chemical was injected using different pumps. The polymer and crosslinker solutions were injected at 1,200 ppm (Pump

1) and 60 ppm (Pump 2), respectively. In this experiment a 50% mixing of the solution was assumed through all the experiment. The interpretation of this coreflood is summarized below:

The injection start at 2ft/day and targeting the injection of 600 ppm of HPAM at a P:CLX of 20:1 (assuming 50% dilution). The sharp polymer production (2nd Y-axis) can be attributed to the inaccessible PV and low probability to interact with the crosslinker at early stages of the co-injection. The pressure build up observed shows a similar pattern than the observed in CDG field projects (Manrique et al., 2014). This gradual increase in the differential pressures clearly suggests that the interaction between the HPAM and Cr(Ac)3 requires time to form CDG agglomerates in-situ. The gradual increase in the differential pressures also support the hypothesis that the first volumes of chemicals injected can be considered as a sacrificial fraction until the CDG’s can be formed in-situ. It is important to mention that at the end of this step of

in the experiment is reasonably valid (injected polymer solution was 1,200 ppm).

After approximately 9 PV of chemical injection the injection rate was reduced from 2ft/day to 1ft/ day keeping the rest of the variables constant. This injection rate (1ft/day) was kept constant until the end of the test. As expected from Darcy’s Law, the differential pressure decreased with the reduction of the injection rates. After few PV of chemicals (CDG) co-injected the pressure build up followed a similar trend than the observed during the previous phase at higher injection rate (2ft/day). During this period polymer was produced at a stable concentration of ≈600 ppm.

After a total of ≈26 PV injected the P:CLX ratio was changed to 6.7:1. The objective of this step was to demonstrate the effects of high concentration of crosslinker on pressures response (Variable used with the reduction of polymer concentration/ viscosity (from 600 to 300 ppm). As expected, polymer produced also decreased due to the lower polymer concentration injected.

After 1 PV injected the P:CLX was increased to 60:1 ( Pump 1 @ 0.75ft/day and Pump 2 @ 0.25ft/ day). This change generated an immediate response in the differential pressures and produced polymer concentration which is consistent with the increase of the polymer concentration injected during this stage of the coreflood. Based on the pressure buildup observed in this stage suggests that the viscous effects seems to be more dominant than the HDD of the CDG at high P:CLX. However, this will require more advanced experiments to confirm this observation (i.e. measure HDD of the CDG injected at the inlet and at the outlet of the core sample).

Figure 17. Effects on changes in injection rates and P:CLX ratios on the differential pressures and polymer production during the co-injection of polymer and crosslinker (Cr(Ac)3)  in a brine saturated Tello core plug.

The test continues injecting Tello synthetic brine causing the sharp decrease in polymer production at a reasonable stable differential pressure. After the interpretation of the tracer results using the MoM (Shook, et al., 2009) a reduction of 19.5% of the PV was calculated. This reduction on PV suggests that the gradual blocking of pore channels (log-jamming mechanism) proposed by Bolandtaba & Skauge (2011) during the injection of LPS can also apply for CDG (microgel) systems.


This test was ended before the stabilization of differential pressure to estimate the RRF. After approximately 50 PV of fluids injected the differential pressure was recorded in 2.75 psi leading to an estimated RRF of 137 that is lot higher than

RRF observed during typical polymer corefloods (RRF = 1-3). Therefore, this result suggests that CDG agglomerates can be formed in-situ. However, evaluating the effects of crosslinker and polymer concentration on HDD observed for CDG systems prepared with Al(Cit)3 (Figure 9 and Figure 10) or Cr(Ac)3 (Figure 15) can’t be used to correlate the differential pressures observed during the co-injection of HPAM and Cr(Ac)3. The impact of microgel formation outside (i.e. bottle tests) and inside the porous media (i.e. constrained space and higher chemical adsorption) needs to be further investigated to improve the understanding of microgel (other than pre-formed systems) flow in porous media.

CONCLUSIONS

Basic differences between LPS and CDG were presented. LPS reports a decrease in viscosity with respect of the original polymer solution when interacting with Aluminum Citrate. This viscosity behavior is the opposite for CDG systems. These differences are attributed to the use of different HPAM polymers.

Based on the particle/agglomerates size or hydrodynamic diameter distributions the crosslinking of the trivalent ion (Al3+) and the negatively charged carboxylic groups of the polymer of both microgels (CDG and LPS) occurs through intra- and inter-molecular interactions and its possible combinations.

The variation of the hydrodynamic diameter distributions (HDD) over time observed for the CDG’s suggests that the interaction between the polymer and crosslinker are complex and highly dynamic. The rate of formation of CDG particles/agglomerates and final HDD after seven days of interaction showed a strong dependency on the concentration of both chemicals.

The CDG systems evaluated in this investigation (HPAM and Al3+) shows smaller HDD than those reported in the literature using Cr3+ as a crosslinker.

However, differences in the experimental conditions (i.e. temperature and water composition) make difficult establishing a reasonable comparison. Therefore, the evaluation of the impact of the type of crosslinker needs to be further investigated.

Revisiting corefloods in Berea and Tello Field core plugs suggests that the mechanisms proposed for LPS flow in porous media are also applicable for CDG. Main mechanisms include viscosity effects, adsorption, straining and log-jamming. However, the viscosity and the reduction of core plug pore volume (log-jamming) effects seem to be more dominant during CDG injection.

The importance of the injection scheme (sequential, freshly prepared or co-injected) of CDG on the interpretation of the technology at lab-scale was demonstrated. The propagation of CDG through different porous media was also presented. Based on the ratio of Al and polymer produced during CDG corefloods (freshly mad or co-injected) suggests the chromatographic separation of polymer and crosslinker at early stages of injection due to the inaccessible pore volume of the polymer and high adsorption of the crosslinker. Hence, the initial volumes of chemicals injected during CDG projects should be considered as a sacrificial fraction of the total volume injected.

It is not clear the possible effects of CDG’s formed insitu during the co-injection of polymer and crosslinker on the HDD and its flow/propagation in the porous media. The study of CDG formation in fluid:fluid (glass bottles) evaluation vs. those formed under dynamic conditions (porous media) is strongly recommended. This research will contribute with the understanding and improve the design of the recovery method.

ACKNOWLEDGMENT

The authors are grateful of the research group in surface phenomena “Michael Polanyi” for their support in the development of the experimental work. The authors also thank Ecopetrol S.A and Nalco for their permission to publish this work.

REFERENCES

Aarra, M., Bjorvisk, M., Hoiland, H., Skodvin, T., Standnes, D. C., & Skauge, A. (2005). Linked Polymer Solutions for Improved Oil Recovery By Waterflooding. 13th European Symposium on Improved Oi Recovery.

Abdulbaki, M., Huh, C., Sepehrnoori, K., Delshad, M., & Varavei, A. (2014). A critical review on use of polymer microgels for conformance control purposes. Journal of Petroleum Science and Engineering. Elsevier. doi:10.1016/j. petrol.2014.06.034.

Alzate, D. (2016). Interpretación de los mecanismos fenomenológicos del proceso de inyección de Geles de Dispersión Coloidal (CDG) en un yacimeinto de hidrocarburos. Universidad Nacional de Colombia. Retrieved from http:// www.bdigital.unal.edu.co/52357/

Bjørsvik, M., Høiland, H., & Skauge, A. (2008). Formation of colloidal dispersion gels from aqueous polyacrylamide solutions. Colloids and Surfaces A: Physicochemical and Engineering Aspects, 317, 504–511. doi:10.1016/j.colsurfa.2007.11.025

Bolandtaba, S. F., & Skauge, A. (2011). Network Modeling of EOR Processes: A Combined Invasion Percolation and Dynamic Model for Mobilization of Trapped Oil. Transport in

Porous Media. doi:10.1007/s11242-011-9775-0

Castro, R. H. (2011). Análisis de un Proceso de Inyección de Geles de Dispersión Coloidal (CDG) usando simulación numérica. Tesis de Maestría En Ingeniería de Hidrocarburos, Universidad Industrial de Santander, Escuela de Ingeniería de Petróleos. doi:10.1007/ s13398-014-0173-7.2

Castro, R., Maya, G., Sandoval, J., León, J., Zapata, J., Lobo, A., … Manrique, E. (2013). Colloidal Dispersion Gels (CDG) in Dina Cretáceos Field : From Pilot Design to Field Implementation and Performance (SPE 165273). SPE Improved Oil Recovery Symposium Held in Kuala Lumpur, Malaysia.

Díaz, D., Saez, N., Cabrera, M., Manrique, E., Romero, J., Kazempour, M., & Aye, N. (2015).

CDG in a Heterogeneous Fluvial Reservoir in Argentina : Pilot and Field Expansion Evaluation. SPE Enhanced Oil Recovery Conference -EORC. Kuala Lumpur, Malaysia.

Gall, J. W. (1973). Subterranean Formation Permeability Correction. US Patent No 3,762,476.

Instruments, M. (2011). Inform White Paper: Dynamic Light Scattering, Common terms defined. Malvern Guides, 1–6.

Kaszuba, M., McKnight, D., Connah, M. T., McNeilWatson, F. K., & Nobbmann, U. (2008). Measuring sub nanometre sizes using dynamic light scattering. Journal of Nanoparticle Research, 10(5),       823–829.   doi:10.1007/ s11051-007-9317-4

León, J. M., Zapata, J. F., Castro, R. H., Reyes, J. D., Ecopetrol, S. A., Fernando, A., ... (2015). Inyección de Geles de Dispersión Coloidal para el Mejoramiento de la Eficiencia de Barrido Volumétrica en Procesos de Inyección de Agua : Del Piloto a la Expansión. XVI Congreso Colombiano Del Petróleo y Gas, (97), 1–15.

Manrique, E., Reyes, S., Romero, J., Aye, N., Kiani, M., Thomas, C., … Cabrera, F. (2014). Colloidal Dispersion Gels (CDG): Field Projects Review (SPE 169705). SPE/DOE EOR Conference at Oil and Gas West Asia. Muscat, Oman.

Moffit, P. D., Zornes, D. R., Moradi-Araghi, A., & McGovern, J. M. (1990). Application of

Freshwater and Brine Polymerflooding in the North Burbank Unit (NBU), Osage County, Oklahoma. 65Th Annual SPE Tech Conf (New Orleans, 9/23-26/90) Proc [G - Eor/General Petroleum Engineering], (199046), 59–71. Retrieved from http://search.ebscohost.com/ login.aspx?direct=true&db=pta&AN=491865

&site=ehost-live

Nelson, E. (1967). Dynamical Theories of Brownian Motion. Mathematical Notes, 131(6), 2381–

2396. doi:10.1103/PhysRev.131.2381

Romero, L. (2009). Colloidal Dispersion Gels (CDG) Versus Polymer Flooding for EOR. In Canadian International Petroleum Conference (p. 2009).

Selle, O. M., Fischer, H., Standnes, D. C., Auflem, I. H., Lambertsen, A. M., Svela, P. E., … Melien, I. (2013). Offshore Polymer / LPS Injectivity Test with Focus on Operational Feasibility and Near Wellbore Response in a Heidrun Injector (SPE 166343 ). SPE Annual Technical Conference and Exhibition Held in New Orleans, Louisiana.

Shook, G. M., Pope G. A., & Asakawa, K. (2009). Determining Reservoir Properties and Flood Performance From Tracer Test Analysis (SPE 124614). SPE Annual Technical Conference and Exhibition Held in New Orleans, Louisiana.

Skauge, T., Djurhuus, K., Hetland, S., Spildo, K., & Skauge, A. (2011). Offshore EOR Implementation – LPS Flooding. 16th European Symposium on Improved Oil Recovery, (April 2011), 12–14. doi:10.3997/2214-4609.201404784

Skauge, T., Hetland, S., Spildo, K., Skauge, A., & Cipr, U. (2010). Nano-Sized Particles for EOR (SPE 129933). SPE Improved Oil Recovery Symposium Held in Tulsa, Oklahoma (April),

24 –28. doi:10.2118/129933-ms

Sorbie, K. S. (1991). Polymer-improved oil recovery.

Spildo, K., Skauge, A., Aarra, M., & Tweheyo, M. (2009). A New Polymer Application for North Sea Reservoirs. SPE Reservoir Evaluation & Engineering, 12(3), 427–432. doi:https://doi.

org/10.2118/113460-PA

Spildo, K., Skauge, A., & Skauge, T. (2010). Propagation of Colloidal Dispersion Gels

(CDG) in Laboratory Corefloods (SPE 129927). SPE Improved Oil Recovery Symposium Held in Tulsa, Oklahoma.

Systems, P. (2012). Nanoplus. Zeta Potential and Nano Particle Analyzer. Retrieved from www.

particulatesystems.com


Recepción: 11  de abril de  2017 Aceptación: 2  de Junio de  2017