Lightning mortality
rate in Colombia for the period
1997 - 2014
Tasa de mortalidad
por rayos en Colombia para el periodo
1997 - 2014
Audrey Soley
Cruz-Bernal1, Horacio Torres-Sánchez2, Harby Aranguren-Fino
3, Juan Carlos
Inampués-Borda4
1Keraunos
S.A.S, Universidad Nacional de Colombia, Colombia. Email: a.cruz@keraunos.co
Keraunos
S.A.S, Research program on acquisition and analysis of signals-PAAS,
Universidad Nacional de Colombia, Colombia. Email: htorress@keraunos.co
Keraunos
S.A.S, Research program on acquisition and analysis of signals-PAAS,
Universidad Nacional de Colombia, Colombia. Email:daranguren@keraunos.co
Keraunos
S.A.S, Research program on acquisition and analysis of signals-PAAS,
Universidad Nacional de Colombia, Colombia. Email:juan.inampues@keraunos.co
Abstract
In many countries, the natural phenomenon of lightning has
been studied take into consideration climatic and physiographic conditions. The
atmospheric discharges are responsible for the death of more than 6000 people
per year around the world. Colombia is located in the intertropical convergence
zone and it has a geography characterized by plains and long mountain ranges.
These conditions locate Colombia in the region in the region with the highest
lightning activity in the world increasing the number of deaths and injuries by
this phenomenon, especially in rural zones. This paper presents a study of the
total number of deaths and the mortality rate by lightnings for the period from
1997 to 2014. The information about deaths by lightning was taken from the statistics
of the National Administrative Department of Statistics (Departamento
Administrativo Nacional de Estadísticas – DANE). The results obtained are
synthesized for the whole country and are discriminated by departments and
natural sub-regions. In this way, the mortality rate obtained for Colombia was
1.51 deaths per million people per year. Likewise, Vichada was the department
with the highest mortality rate (7.85), while Popayan plateau was the natural
sub-region with the highest number of deaths per million people per year with
8.62.
Keywords: deaths by
lightning; lightning; mortality rate; natural sub-regions.
Resumen
En muchos países se ha estudiado el fenómeno natural del
rayo teniendo en cuenta las condiciones climatológicas y geográficas. Estas
descargas atmosféricas son responsables de la muerte de más de 6000 personas
por año en el mundo. Colombia se encuentra ubicada en la zona de convergencia
intertropical y posee una geografía caracterizada por llanuras y largas cadenas
montañosas. Estas condiciones hacen que Colombia esté en la región con mayor
actividad de rayos en el mundo, lo cual incrementa el número de muertos y
heridos a causa de este fenómeno, especialmente, en las zonas rurales. Este
artículo presenta un estudio sobre la cantidad de muertes y la tasa de
mortalidad por rayos en Colombia para el periodo comprendido entre 1997 y 2014.
La información de muertes fue tomada de las estadísticas del Departamento
Administrativo Nacional de Estadísticas (DANE). Los resultados obtenidos se
sintetizan para todo el país y se discriminan por departamentos y subregiones
naturales. De esta manera, la tasa de mortalidad obtenida para toda Colombia
fue de 1,51 muertes por millón de habitantes por año. Así mismo, se encontró
que Vichada es el departamento con mayor tasa de mortalidad (7,85), mientras
que el Altiplano de Popayán es la subregión natural con mayor cantidad muertes
por millón de habitantes por año con 8,62.
Palabras
clave: muertes por rayos; rayos; subregión natural; tasa de
mortalidad.
Introduction
In recent yearsmany investigations [9]–[15]
about lightning fatalities have been conducted in plenty ofcountries.
According to [14],
the fatality rates are lower in developing countries than in lesser-developed
countries. Furthermore, the total number of global annual fatalities by
lightning ranges from 6000 to 24000 per year. In this context, Doljinsuren and
Gomes reported that the fatality rate in Mongolia was 1.54 deaths per million people
per year [10],
which is higher than those in other countries with a similar keraunic level. In
Latin America, the average of human losses due to lightnings is 1.7 per million
people per year in comparison with developing countries that have a mortality
rate of 0.1 per million people per year [15].
In Colombia, few studies have been carried out for
calculating the lightning mortality rate. The most relevant study was presented
by Navarrete et al. in [16].
In this work, a fatality rate of 1.78 deaths per million people per year during
a period of ten years (2000-2009) for all departments of Colombia was
registered. On the other hand, in [17]
a mortality rate of 2 deaths per million people per year was obtained from 2000
to 2012. For these studies, the database of the National Administrative
Department of Statistics (Departamento Administrativo Nacional de Estadísticas
- DANE) and reports from national newspapers were taken into account.
With the aim of extending the results obtained by Cruz and
Navarrete, this paper presents the number of deaths and the mortality rate by
lightning in Colombia for the period from 1997 to 2014. The results obtained
are summarized for the whole country and they are differentiated by departments
and natural su-bregions. In addition, the relation between population density
and ground flash density (GFD) is shown in order to analyze if the mortality
rate in the natural su-bregions is influenced by lightning activity.
Geography of Colombia
Colombia is the only country in South America with coasts
over the Pacific Ocean and the Caribbean Sea. It has a latitudinal location
between 17° north and 4° south, with variable topography, three mountain ranges
and altitudes up to 5000 masl (see Figure 1). Due to this fact, there are
different climatic conditions (warm, tempered, cold, paramo and snowy or
glacial). In addition, Colombia is territorially divided in 32 Departments and
1122 municipalities. The country has a land area of 1.14 million square km with
an approximate population of 49 million of inhabitants (data 2017).
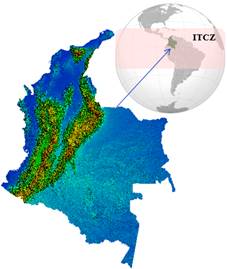
Figure 1. Location and relief of
Colombia.
According to vegetation, relief, weather, soil classes,
among others, Colombia has been divided in 20 sub-regions. These sub-regions
were classified using a methodology based on cluster analysis [18].
This process consists of grouping elements or factors (climatic and
physiographic) trying to achieve maximum homogeneity in each group and the
largest difference between groups.
From the methodology presented in [18]
the sub-regions were named as follows: Caribbean Plain, Middle Magdalena
Valley, Northeast Mountain, Northwest Mountain, Cundiboyacense Plateau, Central
Mountain, Alto Magdalena, Popayan Plateau, South Mountain, Cauca Valley,
Pacific, East Plains Piedmont, Catatumbo, Amazon, Pacific Coastal Plain,
Guajira Plain, Orinoquía, Amazonian Piedmont, Baudó Mountains and Sierra
Nevada.
Methodology
The statistical information of deaths by lightning was obtained
from the database of theANE for the period from 1997 to 2014. DANE is a
governmental institution that collects death certificates occurred for
different causes in Colombia since 1979. It has data about deaths (accidental
or by disease) using the codes provided by the International Classification of
Diseases (ICD). In this way, lightning victims are classified with the code
X33.
Before obtaining information about X33 causethe
statistics were analyzed bearing in mind variables such as: year, month,
department, municipality, gender, type of area (head-municipality, rural and
population center), place (home, hospital, work place, public road, etc). This
information was used in order to know how many people died in each municipality
and to locate them in the Colombia map. Consequently, the mortality rate for
each department and natural sub-region was calculate.
Results
Deaths by lightning in Colombia
From the collected information in the period 1997-2014, 1173
deaths by lightning were found. Figure 2 shows the number of fatalities for
each year. It can be observed that the years with major events were 2003 and
2005 with 98 and 93 deceased persons. On the contrary, less than 50 people died
in 1997 (34), 2010 (44) and 2011 (46).
The annual variation observed in Figure 2 is related with
the "El Niño” and “La Niña" phenomena. El Niño is a meteorological
phenomenon in which the temperature increases and the rainfall decreases. On
the other hand, La Niña is a phenomenon where the temperature
decreases and the rain precipitation increases. These
phenomena in Colombia are periodically observed. However, in some periods, the
rain or dry conditions are extreme.
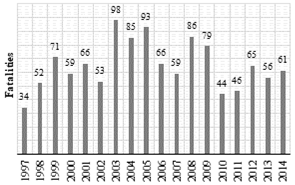
Figure 2. Lightning fatalities in
Colombia. Source. Authors.
Deaths by lightning for departments and natural sub-regions
In accordance with the information found in Colombia, only 8
of 32 departments registered more than 50 deaths. Table
1 shows the fatalities occurred in these departments including the gender of
victims. It can be seen that Antioquia is the department with more deaths by
lightning with 218 events. In addition, male gender is the most affected by
lightning in all Colombia with 959 (82%) cases, while 214 deads (18%) were
females.
Table 1. Departments with more than
50 lightning fatalities.
|
Department
|
Male
|
Female
|
Fatalities
|
|
Antioquia
|
181
|
37
|
218
|
|
Cauca
|
92
|
32
|
124
|
|
Santander
|
64
|
13
|
77
|
|
Cauca Valley
|
65
|
9
|
74
|
|
Bolívar
|
55
|
9
|
64
|
|
Magdalena
|
53
|
6
|
59
|
|
Boyacá
|
40
|
17
|
57
|
|
Córdoba
|
46
|
11
|
57
|
Source. Authors.
Regarding the distribution of fatalities by natural
sub-regions, Figure 3 shows the total number of fatalities by sub-region. It
can be observed that the natural sub-region with more registered cases was the
Caribbean plain with 269 (22%) fatalities. In addition, the Northwest and
Northeast Mountains reported 185 (16%) and 117 (10%), respectively. For the
remaining regions the deaths by lightning were between 97 (8.3%) and 2 (0.2%).
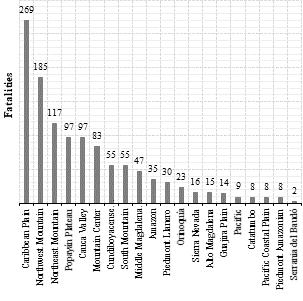
Figure 3. Lightning fatalities in
the natural sub-regions of Colombia. Source. Authors.
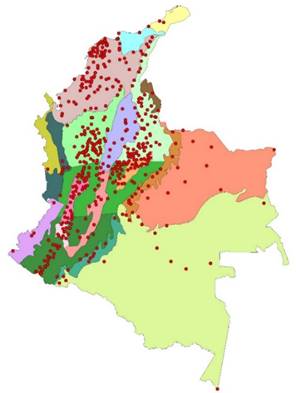
Furthermore, the map with the same events previously
mentioned is shown in Figure 4. In this map, each point highlighted in red
color represents an event. These points were located using the coordinates
(latitude and longitude) of the municipality where the event happened.
Lightning Mortality Rate
In this section, the lightning mortality rate in Colombia is
presented. This parameter is also analyzed in accordance with the departments
and the natural regions. For this work, the mortality rate is defined as the
total number of deaths during a particular period of time among a particular type
or group of people. In addition, the unit of measurement for the mortality rate
used here is per million population per year. Using these definitions, the
lightning mortality rate was calculated using the total number of fatalities by
lightning and the population in each zone (country, department or natural
sub-region).
|
|
 Cundiboyacense
Plateau Cundiboyacense
Plateau
|
|
 Popayán Plateau Popayán Plateau
|
|
 Alto Magdalena Alto Magdalena
|
|
 Amazon Amazon
|
|
 Catatumbo Catatumbo
|
|
 Caribbean Plain Caribbean Plain
|
|
 Pacific Coastal
Plain Pacific Coastal
Plain
|
|
 Guajira Plain Guajira Plain
|
|
 Central Mountain Central Mountain
|
|
 Northeast
Mountain Northeast
Mountain
|
|
 Northwest
Mountain Northwest
Mountain
|
|
 South Mountain South Mountain
|
|
 Orinoquía Orinoquía
|
|
 Pacific Pacific
|
|
 Amazonian
Piedmont Amazonian
Piedmont
|
|
 East Plains
Piedmont East Plains
Piedmont
|
|
 Baudó Mountains Baudó Mountains
|
|
 Cauca Valley Cauca Valley
|
|
 Middle Magdalena
Valley Middle Magdalena
Valley
|
|
 Sierra Nevada Sierra Nevada
|
|
Figure 4. Deaths by lightning and
natural sub-regions in Colombia. Source. Authors.
|
To estimate the population, the methodology presented in
Navarrete et al. was used [16].
In this way, the population of years 2005 and 2006 (the midpoint of the time of
the study) was averaged and included as the denominator of the fatality rate.
Table 2 presents the lightning mortality rate for Colombia and each department.
For the total population of Colombia, a mortality rate of 1.51 deaths per
million people per year was found. The results show that Vichada is the
department with the highest mortality rate (7.85 deaths per million people per
year), while the lower mortality rate was found in Bogotá with 0.1 deaths per
million people per year.
Analyzing Table 2, it can be observed that 63% of the
departments present a lightning mortality rate higher than the value calculated
for Colombia. These values are the result of the relation between the number of
events and the population of the department. From these departments with high
mortality rate, 38% have a population of less than one million people and less
than 30 fatalities were registered, while the remaining 25% of the departments
reported more than 45 cases with a population greater than one million people.
The mortality rate for these departments varies between a minimum value of 1.72
and a maximum value of 7.85 deaths per million people per year.
The mortality rate for the natural sub-regions was also
calculated. The results of this analysis are shown in Table 3. Similarly, in
the natural sub-regions the mortality rate depends on the total number of deaths
and the population for each region. From the 20 sub-regions, 13 exceed the
mortality rate calculated for Colombia (1.5) with values between 1.60 and 8.62
deaths per million people per year.
Accordingly, Popayan plateau is the sub-region with the highest
fatality rate with 8.62, while Cundiboyacense plateau exhibits the lowest
mortality rate with 0.34.
Comparing the results for the Northwest Mountain (2.56) and
the South Mountain region (1.37), it can be observed that the mortality rate is
different although their populations are similar (more than 2.2 million
people). Thereby, it is verified that mortality rate is strongly influenced by
the number of events. For the regions mentioned above, 117 events and 55 events
were found, respectively. The same analysis was made for the Middle Magdalena
Valley and the Pacific Coastal Plain that have a similar population and yet
present a great difference in the mortality rate.
Table 2. Lightning mortality rate deaths per million people per
year by department.
|
Department
|
Deaths
|
Average
Population
|
Deaths/
million-year
|
|
Vichada
|
8
|
56608
|
7.85
|
|
Guainía
|
4
|
35538
|
6.25
|
|
Cauca
|
124
|
1273507
|
5.41
|
|
Guaviare
|
9
|
96343
|
5.19
|
|
Vaupés
|
3
|
39510
|
4.22
|
|
Arauca
|
14
|
233690
|
3.33
|
|
Magdalena
|
59
|
1154980
|
2.84
|
|
Boyacá
|
57
|
1256755
|
2.52
|
|
Caquetá
|
17
|
423133
|
2.23
|
|
Santander
|
77
|
1963063
|
2.18
|
|
Córdoba
|
57
|
1478826
|
2.14
|
|
Antioquia
|
218
|
5720140
|
2.12
|
|
Meta
|
30
|
791933
|
2.10
|
|
Norte de Santander
|
45
|
1249124
|
2.00
|
|
Cesar
|
31
|
909662
|
1.89
|
|
Bolívar
|
64
|
1888756
|
1.88
|
|
Casanare
|
10
|
298324
|
1.86
|
|
La Guajira
|
23
|
695151
|
1.84
|
|
Putumayo
|
10
|
311629
|
1.78
|
|
Caldas
|
30
|
969619
|
1.72
|
|
Sucre
|
21
|
775779
|
1.50
|
|
Chocó
|
12
|
456185
|
1.46
|
|
Cundinamarca
|
48
|
2299559
|
1.16
|
|
Risaralda
|
17
|
900233
|
1.05
|
|
Valle del Cauca
|
74
|
4183349
|
0.98
|
|
Atlántico
|
37
|
2180898
|
0.94
|
|
Tolima
|
23
|
1367462
|
0.93
|
|
Nariño
|
26
|
1551282
|
0.93
|
|
Amazonas
|
1
|
68170
|
0.81
|
|
Quindío
|
7
|
536018
|
0.73
|
|
Huila
|
4
|
1018572
|
0.22
|
|
Bogotá D.C.
|
13
|
6892666
|
0.10
|
|
San Andrés y Providencia
|
0
|
70815
|
0.00
|
|
Total
|
1173
|
43147274
|
1.51
|
Source. Authors.
Table 3. Lightning mortality rate deaths per million people per
year by natural sub-region.
|
Natural Sub-region
|
Deaths
|
Average
Population
|
Deaths/
million-year
|
|
Popayán Plateau
|
97
|
625337
|
8.62
|
|
Orinoquía
|
23
|
279684
|
4.57
|
|
Middle Magdalena Valley
|
47
|
747728
|
3.49
|
|
Amazon
|
35
|
590956
|
3.29
|
|
Northeast Mountain
|
117
|
2535324
|
2.56
|
|
Amazonian Piedmont
|
8
|
188549
|
2.36
|
|
Northwest Mountain
|
185
|
5070344
|
2.03
|
|
Sierra Nevada
|
16
|
440807
|
2.02
|
|
Caribbean Plain
|
269
|
8281868
|
1.80
|
|
East Plains Piedmont
|
30
|
974097
|
1.71
|
|
Central Mountain
|
83
|
2813590
|
1.64
|
|
Pacific
|
9
|
309428
|
1.62
|
|
Guajira Plain
|
14
|
909662
|
1.59
|
|
South Mountain
|
55
|
2229395
|
1.37
|
|
Cauca Valley
|
97
|
5100791
|
1.06
|
|
Baudó Mountains
|
2
|
129652
|
0.86
|
|
Pacific Coastal Plain
|
8
|
763958
|
0.58
|
|
Catatumbo
|
8
|
800302
|
0.56
|
|
Alto Magdalena
|
15
|
1589055
|
0.52
|
|
Cundiboyacense Plateau
|
55
|
9118123
|
0.34
|
|
Total
|
1173
|
43076460
|
1.51
|
Source. Authors.
Relation between population density, GFD and mortality rate
Deaths by lightning are a consequence of the strong
thunderstorms that occur in great part of the Colombian territory. A study
published in 1990 by Universidad Nacional and The Colombian Weather Service
show the first keraunic level map (thunderstorm days) for the country. This map
presents more than 140 thunderstorm days per year for some regions of the
country [19].
consequently, this section shows the influence of lightning activity in the mortality
rate obtained for each sub-region.
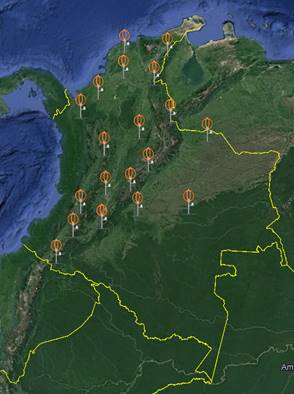
Figure 5. Lightning Location System
(LLS) in Colombia. Source. Keraunos.
According to lightning activity, one of the most important
parameters is ground flash density (GFD). This parameter is the measurement of
the number of lightning strikes to ground in an area of a square kilometer per
year. To calculate this parameter in each natural sub-region the
data provided by Lightning Location System (LLS) installed
in Colombia was used. The LLS is based on LINET Technology [20]
and was implemented in the year 2011. Currently, the system is composed by 19
sensors as shown in Figure 5. During the last six years more than 100 million
strokes have been detected.
In this work, the GFD for 13 of the 20 sub-regions was
calculated. These regions were analyzed due to high lightning activity. The
events were presented mainly in mountains ranges and their vicinity.
Additionally, the population density is other factor that was taken into
account in this analysis and it is also associate with the GFD. The population
density was calculated with the total population and the area of the examined
zone (country or sub-region). As a result, it was possible to obtain the number
of people who inhabit in a square kilometer was obtained. Applying this
definition, the population density for Colombia was 37 people per square
kilometer.
Figure 6 shows the values of GFD for each natural
sub-region. These data are similar to those obtained previously in [13]. In
addition, the average population density during 18 years (1997-2014) was
included. It can be seen that GFD varies between 15.9 flashes/km2-year
and 1.7 flashes/km2-year. The highest values of GFD
were found in the Middle Magdalena Valley region and the
Northwest Mountain region with 15.9 and 10.1 flashes/km2-year,
respectively. However, for these natural sub-regions the population density is
lower than 100 people/km2 and the mortality rate is below to 3.5
deaths/million-year as shown in Figure 7.
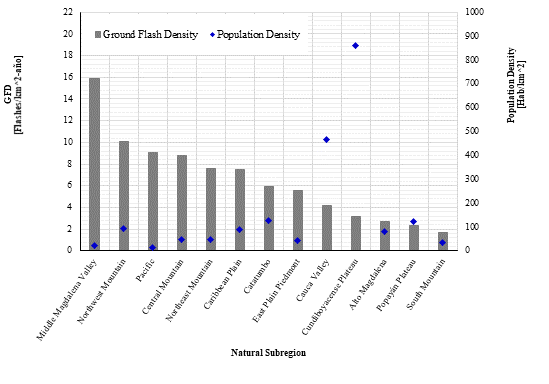
Figure 6. Ground flash density vs population density in 13
natural sub-regions. Source. Authors.
The values of GFD and mortality rate are showed in Figure 7,
these parameters are correlated in 10 sub-regions while in the sub-regions of
Catatumbo, Popayan Plateau and South Mountain mortality rate are higher.
In addition, the sub-regions Cundiboyacense Plateau and
Cauca Valley have lower values of mortality rate and GFD but have a higher
population density with 865 and 465, respectively. These results were obtained
because the population is highest than 5.1 million people.
Figure 7. Ground flash density vs Mortality rate in 13 natural
sub-regions. Source. Authors.
The population density and mortality rate are correlated in
the Figure 8. Taking into account the behavior of the three parameters in the
sub-region of Middle Magdalena Valley, a high value of GFD of 15.9 is observed
along with both a low population density of 21 and a high mortality rate of 3.49.
These results indicate that people who live in this zone are more exposed to be
struck by an atmospheric discharge.
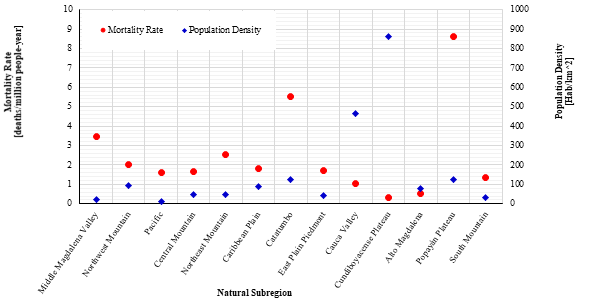
Figure 8. Mortality rate vs Population Density in 13 natural
sub-regions. Source. Authors.
Conclusions
This work discusses the importance of studying the lightning
phenomenon in Colombia since it is one of the latin american countries with
more victims by lightning.
Annually, an average of 65 people dies in Colombia representing
a mortality of more than 1.1 deaths per million people per year.
Based on the information provided by DANE about lightning
fatalities since 1997 to 2014, 1173 cases were registered where the highest
number of cases occurred in 2003 and 2005 with 98 and 93 victims by lightning,
respectively. Besides, just in 25 % of the departments more than 100 dead
people was reported; 82 % were males and 18 % were females.
A Colombia map with the natural sub-regions was elaborated
aiming to show the regions most susceptible to lightning and where more people
died. The regions with more fatalities were the Caribbean Plain, Northwest
Mountain and Northeast Mountain with 269, 185 and 117 cases, respectively.
Departments with the highest mortality rate were Vichada,
Guainía, Cauca and Guaviare with more than 5 deaths per million people over the
year. The natural sub-regions the highest mortality rate were Popayán Plateau,
Orinoquía, Middle Magdalena Valley and Amazon with 8.62, 4.57, 3.49 and 3.29
deaths per million population per year.
The population density and DDT are not correlated but
mortality rate if directly interrelated with DDT. In this way, when the
population density is low, the risk that a person dies by an atmospheric
discharge will be high. In future works is suggested to calculate the GFD for
the sub-regions remaining and update values in the sub-regions that were
determined in this work.
References
[1] Instituto
Colombiano de Normas Técnicas-ICONTEC, NTC 4552-1: Protección contra
descargas eléctricas atmosféricas (Rayos) - Parte 1: Principios Generales.
2008, pp. 1–78.
[2] H. Torres-Sánchez, El rayo:
Mitos, leyendas, ciencia y tecnología, 2da Ed. Bogotá D.C., 2002.
[3] H. Torres-Sánchez, G. Bernal,
R. López, and A. Joya, “Estudio y caracterización de Descargas Eléctricas
Atmosféricas en Colombia.” 1990.
[4] L. Barreto and H.
Torres-Sánchez, “The lightning parameters and its spatial and temporal
dependence. CIGRE.” 1996.
[5] H. Torres-Sánchez, “Variation
of lightning parameter magnitudes within space and time,” Int. Conf. Light.
Prot. ICLP 1998, 1998.
[6] H. E. Rojas, A. S. Cruz, and
C. A. Cortés, “Characteristics of Lightning-generated Electric Fields Measured
in the Bogotá Savanna, Colombia,” Rev. UIS Ing., vol. 16, no. 2, pp.
243–251, 2017. DOI: https://doi.org/10.18273/revuin.v16n2-2017022
[7] E. Soto, E. Perez, and D. Del
Rio, “Obtención del índice de tasa de fallas de líneas de distribución ante
impactos indirectos de rayo en zona tropical,” Rev. UIS Ing., vol. 17,
no. 1, pp. 217–222, 2018. DOI: https://doi.org/10.18273/revuin.v17n1-2018021
[8] C. Younes, “Evaluación de
parámetros del rayo con mediciones terrestres y satelitales para Colombia,”
Universidad Nacional de Colombia - Sede Bogotá, 2002.
[9] K. P. Naccarato, T.
Atmospheric, and E. Group, “Lightning warning and analysis of lightning threats
risks for human life protection in Brazil.,” in International Conference on
Lightning Protection (ICLP 2012), 2012, pp. 1–10.
[10] M. Doljinsuren and C. Gomes,
“Lightning related human casualties in Mongolia,” in International
Conference on Lightning Protection (ICLP 2016), 2016, pp. 1–4.
[11] M. Hajikhani, M. Z. A.
Ab-Kadir, M. Izadi, C. Gomes, and J. Jasni, “Lightning fatalities and injuries
in Malaysia from 2008 to 2015,” in International Conference on Lightning
Protection (ICLP 2016), 2016, pp. 1–6.
[12] R. L. Holle and M. A. Cooper,
“Lightning-caused Deaths and Injuries at Schools,” in International Conference
on Lightning Protection (ICLP 2016), 2016, pp. 1–5.
[13] R. L. Holle,
“Lightning-caused Deaths and Injuries Related to Agriculture,” in International
Conference on Lightning Protection (ICLP 2016), 2016, pp. 1–6.
[14] R. L. Holle, “The Number of
Documented Global Lightning Fatalities,” in International Conference on
Lightning Protection (ICLP 2016), 2016, pp. 1–4.
[15] L. G.
Barrucho, “¿Cuáles son los países latinoamericanos donde hay más muertes por
rayos?,” BBC Mundo, Apr-2014.
[16] N. Navarrete-Aldana, M. A.
Cooper, and R. L. Holle, “Lightning fatalities in Colombia from 2000 to 2009,”
in International Conference on Lightning Protection (ICLP 2014), 2014,
pp. 40–46.
[17] C. A. Cruz Mosquera,
“Evaluación del Riesgo por Rayos Incluyendo un Sistema de Alarma de Tormentas (
SAT ) en Colombia,” Universidad Nacional de Colombia, 2015.
[18] Keraunos S.A.S,
“Identificación y Análisis de los Niveles de Calidad del Servicio Alcanzables
en las Redes de Distribución de Energía Eléctrica del SIN,” Bogotá D.C., 2013.
[19] H. Torres, G. Bernal, R.
López, andg A. Joya, “Estudio caracterización D.E.A. en Colombia,” 1990.
[20] H.-D. Betz, K. Schmidt, P.
Oettinger, and M. Wirz, “Lightning detection with 3-D discrimination of
intracloud and cloud-to-ground discharges,” Geophys. Res. Lett., vol.
31, no. 11, Jun. 2004.