Voltage sag state
estimation based on  -norm minimization methods in radial
electric power distribution systems
-norm minimization methods in radial
electric power distribution systems
Estimación de estado
de hundimientos de tensión basada en métodos de minimización de la norma- en sistemas
radiales de distribución de energía eléctrica
Jairo Blanco-Solano1,
Nelson Kagan2, Carlos Frederico M. Almeida3, Johann F.
Petit-Suárez4, Gabriel
Ordóñez-Plata5
1Grupo de
Investigación en Sistemas de Energía Eléctrica (Gisel), Escuela de Ingenierías
Eléctrica, Electrónica y de Telecomunicaciones, Universidad
Industrial de Santander, Colombia. Email: jairo.blanco@correo.uis.edu.co
2Centro de
Estudos em Regulação e Qualidade de Energia (Enerq),
Departamento de Engenharia de Energia e Automação Elétricas, Universidade de
São Paulo, Brasil. Email: nelsonk@pea.usp.br
3Centro de Estudos em Regulação e Qualidade de Energia (Enerq), Departamento de Engenharia de Energia e Automação
Elétricas, Universidade de São Paulo, Brasil. Email: cfmalmeida@usp.br
4Grupo de Investigación en Sistemas de Energía
Eléctrica (Gisel), Escuela de Ingenierías Eléctrica, Electrónica y de
Telecomunicaciones, Universidad Industrial de Santander,
Colombia. Email: jfpetit@uis.edu.co
5Grupo de Investigación en Sistemas de Energía
Eléctrica (Gisel), Escuela de Ingenierías Eléctrica, Electrónica y de
Telecomunicaciones, Universidad Industrial de Santander,
Colombia. Email: gaby@uis.edu.co
Abstract
Voltage sags have a high impact on the proper equipment
operation and the electric power end-user processes continuity. Economic losses
are a growing problem for the electric utilities, regulators and electric
energy final customers and therefore, the formulation of new mathematical
methods for voltage sags diagnosis are needed. In this sense, the state
estimation methods seek the determination of the frequency or the number of
voltage sags that an end-user would experience. In this research area,
optimization problems based on techniques such as singular value decomposition,
voltage profile curve fitting and voltage sag source location have been
formulated. The results of these approaches may be inaccurate when the
pre-fault currents, non-zero fault impedances and unbalanced conditions are
considered. We will evidence that the results from singular value decomposition
method are inaccurate considering these real fault conditions. Also, a new
mathematical formulation of the voltage sag state estimation problem based on
ℓ1-norm minimization is proposed in this work. The proposed method is applied
and validated to the IEEE 33-node test distribution network. Voltage sags
caused for network faults are only considered. The results validate a
remarkable improvement in comparison with the singular value decomposition
method and show an innovative tool for voltage sags state estimation in radial
electric power distribution systems.
Keywords: power
quality; voltage sags; state estimation; ℓ1-norm;
distribution networks.
Resumen
Los hundimientos de tensión tienen un alto impacto sobre la
correcta operación de equipos y en la continuidad de los procesos en el usuario
final de energía eléctrica. Las pérdidas económicas son un problema en
crecimiento para las empresas operadoras, para los mismos reguladores y por
supuesto para los consumidores finales del servicio de energía eléctrica; es
así como se hace necesario la formulación de nuevos métodos matemáticos para el
diagnóstico de los hundimientos de tensión. En este sentido, los métodos de
estimación de estado buscan determinar la frecuencia o el número de
hundimientos de tensión que experimenta un usuario final. En esta área de
investigación se han formulado problemas de optimización basados en técnicas
como la descomposición en valores singulares, el ajuste de perfiles de tensión
y la localización de las fuentes generadoras de los hundimientos de tensión.
Los resultados obtenidos usando
estas técnicas son imprecisas cuando se consideran las
corrientes pre-falla, las fallas con impedancia diferente de cero y los
desbalances. Es así como en este artículo se evidenciará que, al considerar
estas condiciones reales de las fallas, se obtienen resultados imprecisos para
el caso del método de descomposición en valores singulares. A su vez, en este
trabajo se propone una nueva formulación matemática del problema de estimación
de estado de hundimientos de tensión usando la minimización de la norma-ℓ1.
Esta propuesta matemática es aplicada y validada en la red de distribución de
prueba de 33 nodos del IEEE. Únicamente los hundimientos de tensión causados
por fallos en la red de distribución serán considerados. Los resultados
obtenidos validan una notable mejora en comparación con el método de
descomposición en valores singulares y resaltan una innovadora herramienta para
la estimación de estado de los hundimientos de tensión en redes radiales de
distribución.
Palabras
clave: calidad de potencia; hundimientos de tensión; estimación de
estado; norma-ℓ1; redes eléctricas
de distribución.
Introduction
Voltage sags are one of the most frequent power quality
disturbances. The economic losses may oscillate between the US$ 5.000 to US$
2.500.000 per each voltage sag experienced [1],
[2]. These losses are evidenced in the equipment bad-operation and the
processes interruption in the end-user. Voltage sags are caused often by short
circuits and several studies have been focused to analyze the voltage sag
phenomena taking into account this cause [3]–[5].
In turn, voltage sag monitoring programs are still very limited and only a few
busbars are monitored in the current distribution networks. A partial
monitoring system can provide information to the estimation methods to
determine voltage sag indices at unmetered busbars. For this, further studies
are required in this research area.
Voltage Sag Estimation (VSE) is defined as the task on
estimating the voltage sags number at unmetered busbars by using the collected
data at a limited number of meters
installed in the network [5],[6].
Two approaches were found: the methods that realize stochastic prediction and
the methods based on the conventional state estimation, where measurements and
simulation are used simultaneously.
A probabilistic method to obtain the
most probable voltage sag index at unmetered busbars given a measurements set
is presented in [8].
Voltage sag measurements are assessed into of disturbance database using a
Bayesian filter. Other works also use statistical modelling to analyze the
fault networks [9],
[10]. The results of these methods are sensitive to the high variability of
fault statistical data, so the voltage sag number may be
inaccurate.
VSE problem can also be formulated as
an undetermined linear system based on the fault position concept [11].
Singular Value Decomposition (SVD) technique allows to estimate the number of
voltage sags in unmetered busbars. SVD method is based on the least-squares and
gets a solution with minimum (Euclidean) norm. Thus, this method tends to
obtain a state vector with many nonzero values. On the other hand, ℓ1-norm
minimization method solves an undetermined linear problem while the optimal
vector is sparse [12].
Many applications of ℓ1-norm minimization in power
systems are coming due to its emerging potentiality [13],
[14].
This work presents a new approach to solve the voltage sag
state estimation problem based on ℓ1-norm minimization methods. The main
contribution is a new mathematical formulation of the VSE problem and the
assessment of two of the most popular solvers of ℓ1-norm
minimization problem.
This research is organized as
follows. Section 2 provides a description of the SVD method and the new
mathematical formulation using ℓ1-norm minimization is explained in
detail. Section 3 presents the simulation results of the SVD and proposed
method for the 33-node test distribution system. Finally, conclusions are
presented in section 4.
VSE mathematical modeling
Several mathematical and stochastic approaches have been
formulated to solve the voltage sag estimation problem [9],
[11], [15]. Stochastic methods are subject to high inaccuracies due to the
network fault uncertainties and it is not possible to assess the optimality and
convergence criteria in the results obtained. Due to
this and to take advantage of the emerging technologies for the power system
monitoring, this work is focused on the mathematical formulation that uses the
voltage measurements in electric power distribution systems.
VSE
using Singular Value Decomposition
State estimation in power systems is defined as the task of
estimating the voltages and currents on the electric network. The state estimation formulation is based on a measurement
vector (b), a measurement matrix (A), a state vector (x)
and a measurement error vector (e). Equation (1) shows the mathematical
representation when the measurement error is neglected. This formulation is
frequently used in the voltage sag state estimation.
|
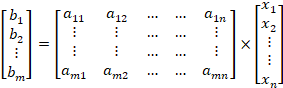
|
(1)
|
In [11],
the mathematical formulation in (1) is development to voltage sag estimation.
This formulation is explained below.
Measurement
matrix (A)
Amt×n is a binary matrix built by a short circuit study in the n
fault positions on the network. The short circuit study is performed using the
fault mathematical formulation or a software as NEPLAN, DIGSILENT Power
Factory, PSCAD, ATP-EMTP, among others. Residual voltages in mt measurement points are
recorded and compared with k thresholds. Two submatrices are derived
here:  relates
the residual voltages from m busbars metered with the n fault
positions.
relates
the residual voltages from m busbars metered with the n fault
positions.  relates
the residual voltages from nm unmetered busbars with the n
fault positions. The rules
applied to derive these matrices are shown in table 1.
relates
the residual voltages from nm unmetered busbars with the n
fault positions. The rules
applied to derive these matrices are shown in table 1.
These matrices may also be built for each fault type for a
better performance of the voltage sag estimation method.
Table 1. Values of the  and
and  matrices.
Source: Own elaboration.
Measurement
vector (b)
bm×1
is formed by voltage sag measurements obtained from m real meters
installed on the network. Real residual voltages recorded are used to build
b. Each element of b corresponds to an integer number obtained by
counting the voltage sags number.
Optimization
problem and voltage sag estimation
Optimization problem shown in (2) is solved using Am
and b, without any constraints.
|

|
(2)
|
The optimal solution x* is obtained using
the deterministic approach of SVD, as shown in (3)
|

|
(3)
|
where U, W and V are the matrices
obtained from the decomposition of Am using SVD. If a
set of thresholds thrk, for k=1,2,...,T, is defined,
then an augmented problem can be formulated as shown in (4).
|
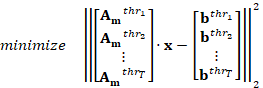
|
(4)
|
Solving the
equation (4), the optimal solution x* is finally used in (5)
to calculate the voltage sags number  at
unmetered busbars.
at
unmetered busbars.
|
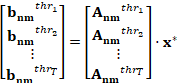
|
(5)
|
Proposed
Method: VSE using  1-norm
minimization
1-norm
minimization
Now, several issues in the VSE problem may be discussed:
·
The physical interpretation of x* allows to conclude that
for a set of voltage sags registered, all fault positions (values of the state
vector x) cannot have failed. In real power systems, several busbars and
lines have a higher fault probability that others. Thus, the SVD method tends
to obtain a state vector with many non-zero values and this does not meet the
actual distribution of the network faults in power systems. Therefore, the
state vector should be sparse with few non-zero values.
·
The optimal vector x* is obtained only considering the
Am matrix. Equation (1) is an under-determined linear system and we found
the first error source to estimate the actual number of network faults occurred
here. If x* is not a good estimation, then the results of (5) can be more
inaccurate. Thus, we raise that a sparse optimal vector x* minimizes the error
on
voltage sag estimation in (5), this due to
the sparse nature in the measurement matrix construction.
·
The square error minimization in (2) is still an optimization
goal that should be used.
According to the above, a new hypothesis may be inferred,
stating that a sparse vector represents better the network fault nature and
thus the voltage sags estimation may be more accurate.
The mathematical formulation of the VSE, as a sparse
problem, is the main contribution of this paper. This formulation allows us to
exploit the problem structure using ℓ1-norm minimization algorithms.
Optimization
problem and voltage sag estimation
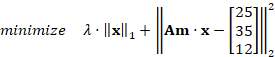
The proposed optimization problem is presented in (6). It is
often known as ℓ1-regularized least-squares problem and allows the
achievement of the two main goals of this work hypothesis: a sparse vector
while the square error is minimized [12].
This approach is widely applied in compressive sensing that is an emerging
research area with many applications in the last years.
|

|
(6)
|
An optimal state vector  is
obtained and the number of voltage sags at nm unmetered busbars (
is
obtained and the number of voltage sags at nm unmetered busbars ( ),
like to SVD, is calculated using equation (7).
),
like to SVD, is calculated using equation (7).
|

|
(7)
|
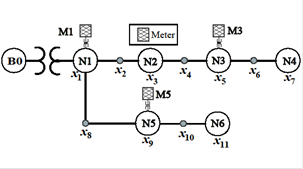
Figure 1. Illustrative three-phase distribution system. Source:
Own elaboration.
Only a voltage sag detection threshold equal to 0.9 pu was
considered in the case study
presented in section 3.
Illustrative
distribution system
A small distribution system is shown in Figure 1. There are
six load nodes, three voltage meters installed and the fifteen points indicate
the fault positions defined in the system. Am and Anm
are built using a detection threshold equal to 0.9 p.u and are shown in Tables
2-3.
In this case study, a set of 40 faults is simulated during a
year. Residual voltages are taken from the meters installed and the measurement
vector b is obtained. Finally, equation (8) is solved and the optimal
value x* is used in (7) to calculate the voltage sags number at
unmetered busbars.
Table 2. Am for the distribution system in
Figure 1.
|
|
x1
|
x2
|
x3
|
x4
|
x5
|
x6
|
x7
|
x8
|
x9
|
x10
|
x11
|
|
M1 (x1)
|
1
|
1
|
1
|
0
|
0
|
0
|
0
|
1
|
1
|
0
|
0
|
|
M2 (x5)
|
1
|
1
|
1
|
1
|
1
|
1
|
0
|
1
|
1
|
0
|
0
|
|
M3 (x9)
|
1
|
1
|
1
|
0
|
0
|
0
|
0
|
1
|
1
|
1
|
0
|
Source: Own elaboration.
Table 3. Anm for the distribution system in
Figure 1.
|
|
x1
|
x2
|
x3
|
x4
|
x5
|
x6
|
x7
|
x8
|
x9
|
x10
|
x11
|
|
(x2)
|
1
|
1
|
1
|
1
|
0
|
0
|
0
|
1
|
1
|
0
|
0
|
|
(x3)
|
1
|
1
|
1
|
1
|
1
|
0
|
0
|
1
|
1
|
0
|
0
|
|
(x4)
|
1
|
1
|
1
|
1
|
1
|
0
|
0
|
1
|
1
|
0
|
0
|
|
(x6)
|
1
|
1
|
1
|
1
|
1
|
1
|
1
|
1
|
1
|
0
|
0
|
|
(x7)
|
1
|
1
|
1
|
1
|
1
|
1
|
1
|
1
|
1
|
0
|
0
|
|
(x8)
|
1
|
1
|
1
|
0
|
0
|
0
|
0
|
1
|
1
|
1
|
0
|
|
(x10)
|
1
|
1
|
1
|
0
|
0
|
0
|
0
|
1
|
1
|
1
|
1
|
|
(x11)
|
1
|
1
|
1
|
0
|
0
|
0
|
0
|
1
|
1
|
1
|
1
|
Source: Own elaboration.
|
|
(8)
|
|
|
|
ℓ1-norm
minimization algorithms
Two of the most robust and popular solvers of ℓ1-regularized
least-squares problem are presented below.
Gradient Projection for Sparse
Reconstruction (GPSR) [16]
GPSR is based on gradient projection algorithms to solve a
bound-constrained quadratic programming problem. According to the authors, this
approach provides faster solutions compared with interior-point techniques. The
model used is presented in (9).
|

|
(9)
|
CVX solver [17],
[18]
CVX is a robust modeling system to solve disciplined convex
programs (DCPs). For the optimization problem shown in (6), CVX exploits the
problem structure of a problem that can be reformulated as a convex quadratic
program with bound constraints. SDPT3 is an algorithm based on the primal-dual
interior-point method that uses the path-following paradigm. Equation (10)
presents the model that CVX solves.
|

|
(10)
|
Simulation and discuss
The 33-node test distribution system, 12.66 kV, is used to
validate the proposed VSE method using ℓ1-norm minimization
algorithms. In other studies of techniques for optimal placement of PMUs are
validated using this test system [19].
Also, this electrical system is used in reconfiguration studies, but we will
only use its reconfiguration base case shown in figure 2.
The case of study in this paper consists to realize a large
number of network faults on the 33-node test distribution system and to apply
the VSE proposed to estimate the number of voltage sags at unmetered busbars.
The simulation process is summarized below.
·
Stage 1: Zero impedance faults are made in all fault positions
using ATP-EMTP package. 128 fault positions are defined in our test system,
applying a segmentation of 25 percent in each line. All network fault types are
considered: line-to-ground (LG); line-to-line (LL); line-to-line-to-ground
(LLG) and three-line (LLL). Three Monte Carlo simulations are performed to
validate the proposed VSE method.
·
Stage 2: A monitoring system is defined. Nine meters are located
according to the methodology presented in [20].
Measurement matrices ( and
and
 ) are
built, one for each fault type.
) are
built, one for each fault type.
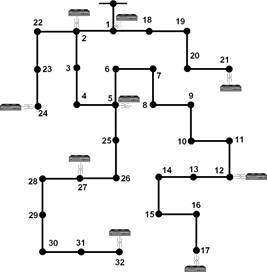
Figure 2. 33-node test distribution system. Source: Own
elaboration.
The information obtained from the simulation process is
equivalent to that provided by the monitoring systems in the real distribution
systems. The next step is to apply the VSE proposed. The stages are:
·
Stage 1: Measurement vector (b) is built from Monte Carlo
simulation. A threshold equal to 0.9 pu is considered for ℓ1-norm
methods. Four thresholds, 0.9, 0.7, 0.5 and 0.3 pu, are used in SVD method.
·
Stage 2: The optimization problems shown in (2), (8) and (9) are
solved. Number of voltage sags at nm unmetered busbars ( ) is
obtained using (7).
) is
obtained using (7).
Validation
sceneries obtained from Monte Carlo simulations
Table 4 shows the statistical data used in Monte Carlo
scenarios (MC1, MC2 and MC3) [21].
Fault impedances (Zf) are calculated from a normal distribution.
Regularization
parameter tuning
Optimization problems into of the ℓ1-minimization
solvers are dependent on λ (lambda) parameter, which should be analyzed
initially.
Table 4. Statistical data used in Monte Carlo simulations.
|
MC
|
Faults
|
Zf
|
Fault type
|
Total
|
|
1
|
Busbars
0.08 faults/
year
Lines
3.7
faults/ year
|
µ= 5 Ω
σ= 2 Ω
|
LG= 80%
LLG= 10%
LL= 5%
LLL= 5%
Randomly locations
|
1 year:
123 faults
|
|
2
|
µ= 0.5 Ω
σ= 0.3 Ω
|
1 year:
123 faults
|
|
3
|
µ= 5 Ω
σ= 2 Ω
|
20 years
2374
faults
|
Source: Own elaboration.
A subset of network faults is taken from the validation
scenarios and the objective function value is assessed for all fault types.
Figure 3 shows the regularization parameter effect on the objective function.
Lambda values lower to 10-3 are suitable to
achieve the highest accuracy in VSE problem. We take λ=4×10⁻⁵ in the
results presented at the next section.
Results
and discussion
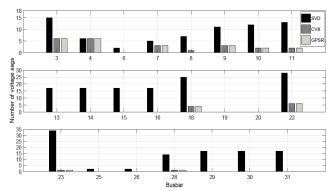
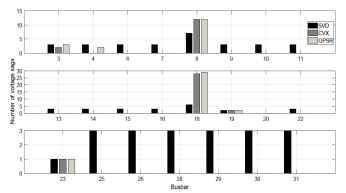
Figure 4 shows the voltage sags number that was incorrectly
estimated. The real values of the number of voltage sags are obtained from the
simulation process in ATP-EMTP. All 23 unmetered busbars are analyzed for the
MC1 and MC2 validation scenarios. Also, all fault types are considered in these
results.
Figure 4a shows a typical scenario for one year, where the
SVD method presents the lower performance. This is due to its poor performance
when network faults with fault impedance are presented. It is generally found
that CVX and GPSR solvers present the same accuracy.
Figure 4b aims to show a better performance in SVD method
when the network faults have Zf lower values. Voltage sags number
incorrectly estimated is similar in almost all busbars and thus ratifies the
hypothesis presented initially. The voltage sags are even better estimated at 8
and 18 busbars using SVD.
Finally, a big set of network faults is assessed. Figure 5
shows the overall performance of the proposed method, where the best global
efficiencies are obtained with the
ℓ1-norm methods. It´s clear that this last
scenario is not sparse due to all fault positions are faulted. Despite this,
the ℓ1-norm methods still present the best results. The main
property of ℓ1-norm methods is its immunity to high fault
impedances, which is the most real conditions in power systems.
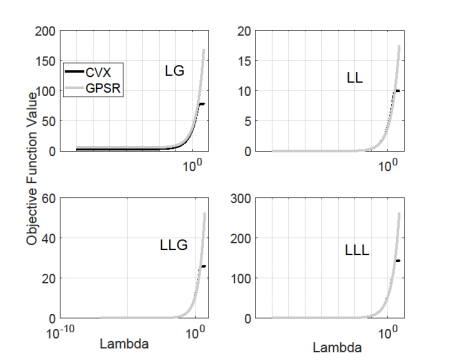
Figure 3. λ parameter versus objective function. Source: Own
elaboration.
b)
Figure 4. Voltage sags number incorrectly estimated. a) MC1; b)
MC2 Source: Own elaboration.
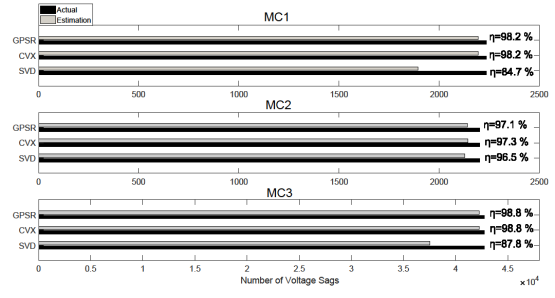
Figure 5. Global efficiencies of the VSE methods. Source: Own
elaboration.
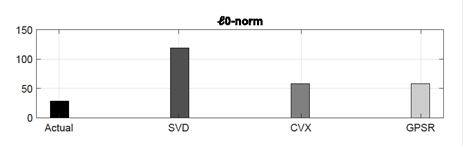
Figure 6. Sparsity property of the optimal vector x* in MC1.
Source: Own elaboration.
These results indicate that the VSE proposed has a good
performance under the real conditions of the fault in the radial electric power
distribution systems. This fact is decisive for a real implementation.
Figure 6 presents the sparsity of the optimal vector x*.
Line-to-ground faults are only considered because are the most numerous in the
validation sceneries. For this, the ℓ0-norm is calculated and it’s
compared to the real fault location vector. The MC1 case is only presented
because the sparsity is almost null in the other cases. Despite the voltage
sags estimation has a good performance, a new mathematical formulation could be
proposed where the sparse property will be exploited even more.
These additional results also validate the fact that the
problem modelling based on ℓ1-norm method is coherent with the
physical features of the fault networks.
To conclude, several additional issues are discussed for
future research:
·
Measurement errors were not considered. However, the square error
term in (6) allows to consider this issue. The sensitivity to measurement error
can be tested in future works.
·
The number of fault positions is a criterion to analyze. Typical
distances used in fault location
programs in distribution systems may be taken into consideration.
·
Meters placement is an important issue because it defines the
measurement matrix properties [22].
A rigorous study should determine the impact of these properties on the ℓ1-norm
algorithm’s performance.
Conclusions
Mathematical formulations to voltage sag estimation are very
few yet. This work demonstrated that the SVD method presents inaccurate
estimations in real fault sceneries with high fault impedances. This paper also
proposed a new method for estimating the voltage sags number using a formulation
based on the ℓ1-norm minimization algorithms. Case of studies have
shown that ℓ1-norm methods present the best performance. All fault
types and a wide range of fault impedances were considered. The main finding to
highlight is the low impact of these variables on the algorithm’s accuracy.
About computing time and accuracy, the CVX solver worked better in all cases.
Finally, the authors highlight new research goals to meet and are already
working on new and best mathematical formulations for voltage sags estimation
using the compressive sensing theory.
References
[1] J. W. G. CIGRE/CIRED C4.107, “Economic Framework for
Voltage Quality,” CIGRE, pp. 1–151, 2011.
[2] F. Salim, K. M. Nor, D. M. Said, and A. A. A. Rahman,
“Voltage sags cost estimation for Malaysian industries,” in IEEE
International Conference on Power and Energy, PECon, 2014, pp. 41–46.
[3] S. Jamali, A. Bahmanyar, and E. Bompard, “Fault location
method for distribution networks using smart meters,” Measurement, vol.
102, pp. 150–157, 2017.
[4] N. C. Woolley, M. Avendaño-Mora, A. P. Woolley, R.
Preece, and J. V. Milanovic, “Probabilistic estimation of voltage sags using
erroneous measurement information,” Electr. Power Syst. Res., vol. 106,
pp. 142–150, 2014.
[5] L. E. Perdomo-Orjuela, A. A. Rodríguez, and F.
Santamaría, “Metodología para el registro de parámetros de calidad de energía
en microrredes Inteligentes,” Rev. UIS Ing., vol. 15, no. 2, pp.
117–123, 2016.
[6] I. B. N. C. Cruz, A. P. Lavega, and J. R. C. Orillaza,
“Overview of Methods for Voltage Sag Performance Estimation,” in Harmonics
and Quality of Power (ICHQP), 2016 17th International Conference on, 2016,
pp. 508–512.
[7] A. Al-Wakeel, J. Wu, M. Verga, and N. Jenkins, “State
estimation of low voltage microgrid using an iteratively reweighted least
squares method,” CIRED Work., no. 0383, pp. 1–5, 2014.
[8] X. Zambrano, A. Hernandez, M. Izzeddine, and R. M. De
Castro, “Estimation of Voltage Sags from a Limited Set of Monitors in Power
Systems,” IEEE Trans. Power Deliv., vol. 32, no. 2, pp. 656–665, 2017.
[9] N. C. Woolley, M. Avendaño-Mora, A. P. Woolley, R.
Preece, and J. V. Milanovic, “Probabilistic estimation of voltage sags using
erroneous measurement information,” Electr. Power Syst. Res., vol. 106,
pp. 142–150, 2014.
[10] J. C. Cebrian, N. Kagan, and J. V Milanović,
“Probabilistic Estimation of Distribution Network Performance With Respect to
Voltage Sags and Interruptions Considering Network Protection Setting : Part I
– The Methodology,” IEEE Trans. Power Deliv., vol. PP, no. 99, pp. 1–9,
2017.
[11] A. Hernández, E. Espinosa-juárez, and R. M. De Castro,
“SVD Applied to Voltage Sag State Estimation,” IEEE Trans. Power Deliv.,
vol. 28, no. 2, pp. 866–874, 2013.
[12] S.-J. Kim, K. Koh, M. Lustig, S. Boyd, and D.
Gorinevsky, “An Interior-Point Method for Large-Scale L1-Regularized Least
Squares,” IEEE J. Sel. Top. Signal Process., vol. 1, no. 4, pp. 606–617,
2007.
[13] M. Majidi, H. Livani, and M. Etezadi-Amoli, “Distribution
system state estimation using compressive sensing,” Electr. Power Energy
Syst., vol. 88, pp. 175–186, 2017.
[14] M. Majidi, M. Etezadi-Amoli, H. Livani, and M. S.
Fadali, “Distribution systems state estimation using sparsified voltage
profile,” Electr. Power Syst. Res., vol. 136, pp. 69–78, 2016.
[15] J. E. R. Baptista, A. B. Rodrigues, and M. da G. da
Silva, “Two Probabilistic Methods for Voltage Sag Estimation in Distribution
Systems,” in 2016 Power Systems Computation Conference (PSCC), 2016, pp.
1–7.
[16] M. Figueiredo, R. Nowak, and S. J. Wright, “Gradient
projection for sparse reconstruction: application to compressed sensing and
other inverse problems,” IEEE J. Sel. Top. Signal Process., vol. vol,
no. 4, pp. 586–597, 2007.
[17] I. CVX Research, “CVX: Matlab software for disciplined
convex programming.” 2013.
[18] S. Boyd and L. Vandenberghe, Convex Optimization.
Cambridge University Press, 2010.
[19] H. A. Abdelsalam, A. Y. Abdelaziz, and V. Mukherjee,
“Optimal PMU placement in a distribution network considering network
reconfiguration,” 2014 Int. Conf. Circuits, Power Comput. Technol. ICCPCT
2014, pp. 191–196, 2014.
[20] J. Blanco Solano, J. F. Petit, and G. Ordonez Plata,
“Optimal placement of voltage sag monitors in smart distribution systems:
Impact of the dynamic network reconfiguration,” in 2015 IEEE PES Innovative
Smart Grid Technologies Latin America (ISGT LATAM), 2015, pp. 361–365.
[21] M. Avendaño-Mora and J. V. Milanović, “Monitor placement
for reliable estimation of voltage sags in power networks,” IEEE Trans.
Power Deliv., vol. 27, no. 2, pp. 936–944, 2012.
[22] E. Cabezas-Jaimes, J. Blanco-Solano, J. Petit, and G.
Ordóñez-Plata, “Optimal Placement of Voltage Sag Meters in Distribution
Networks using Fault Location Constraints,” Rev.UIS Ing., vol. 16, no.
2, pp. 253–261, 2017.